It's Still Source, Target, and Value. There's Just More Than One Set of Them.
Every explanation of a flow starts with the same three words: Source, Target, Value. One thing leads to another, and a number describes how much. That's true, and it's also easy to read as "pick exactly two columns and you're done." Most real datasets have more than two categories worth showing, and the P&L file behind this post is a good example of why that matters.
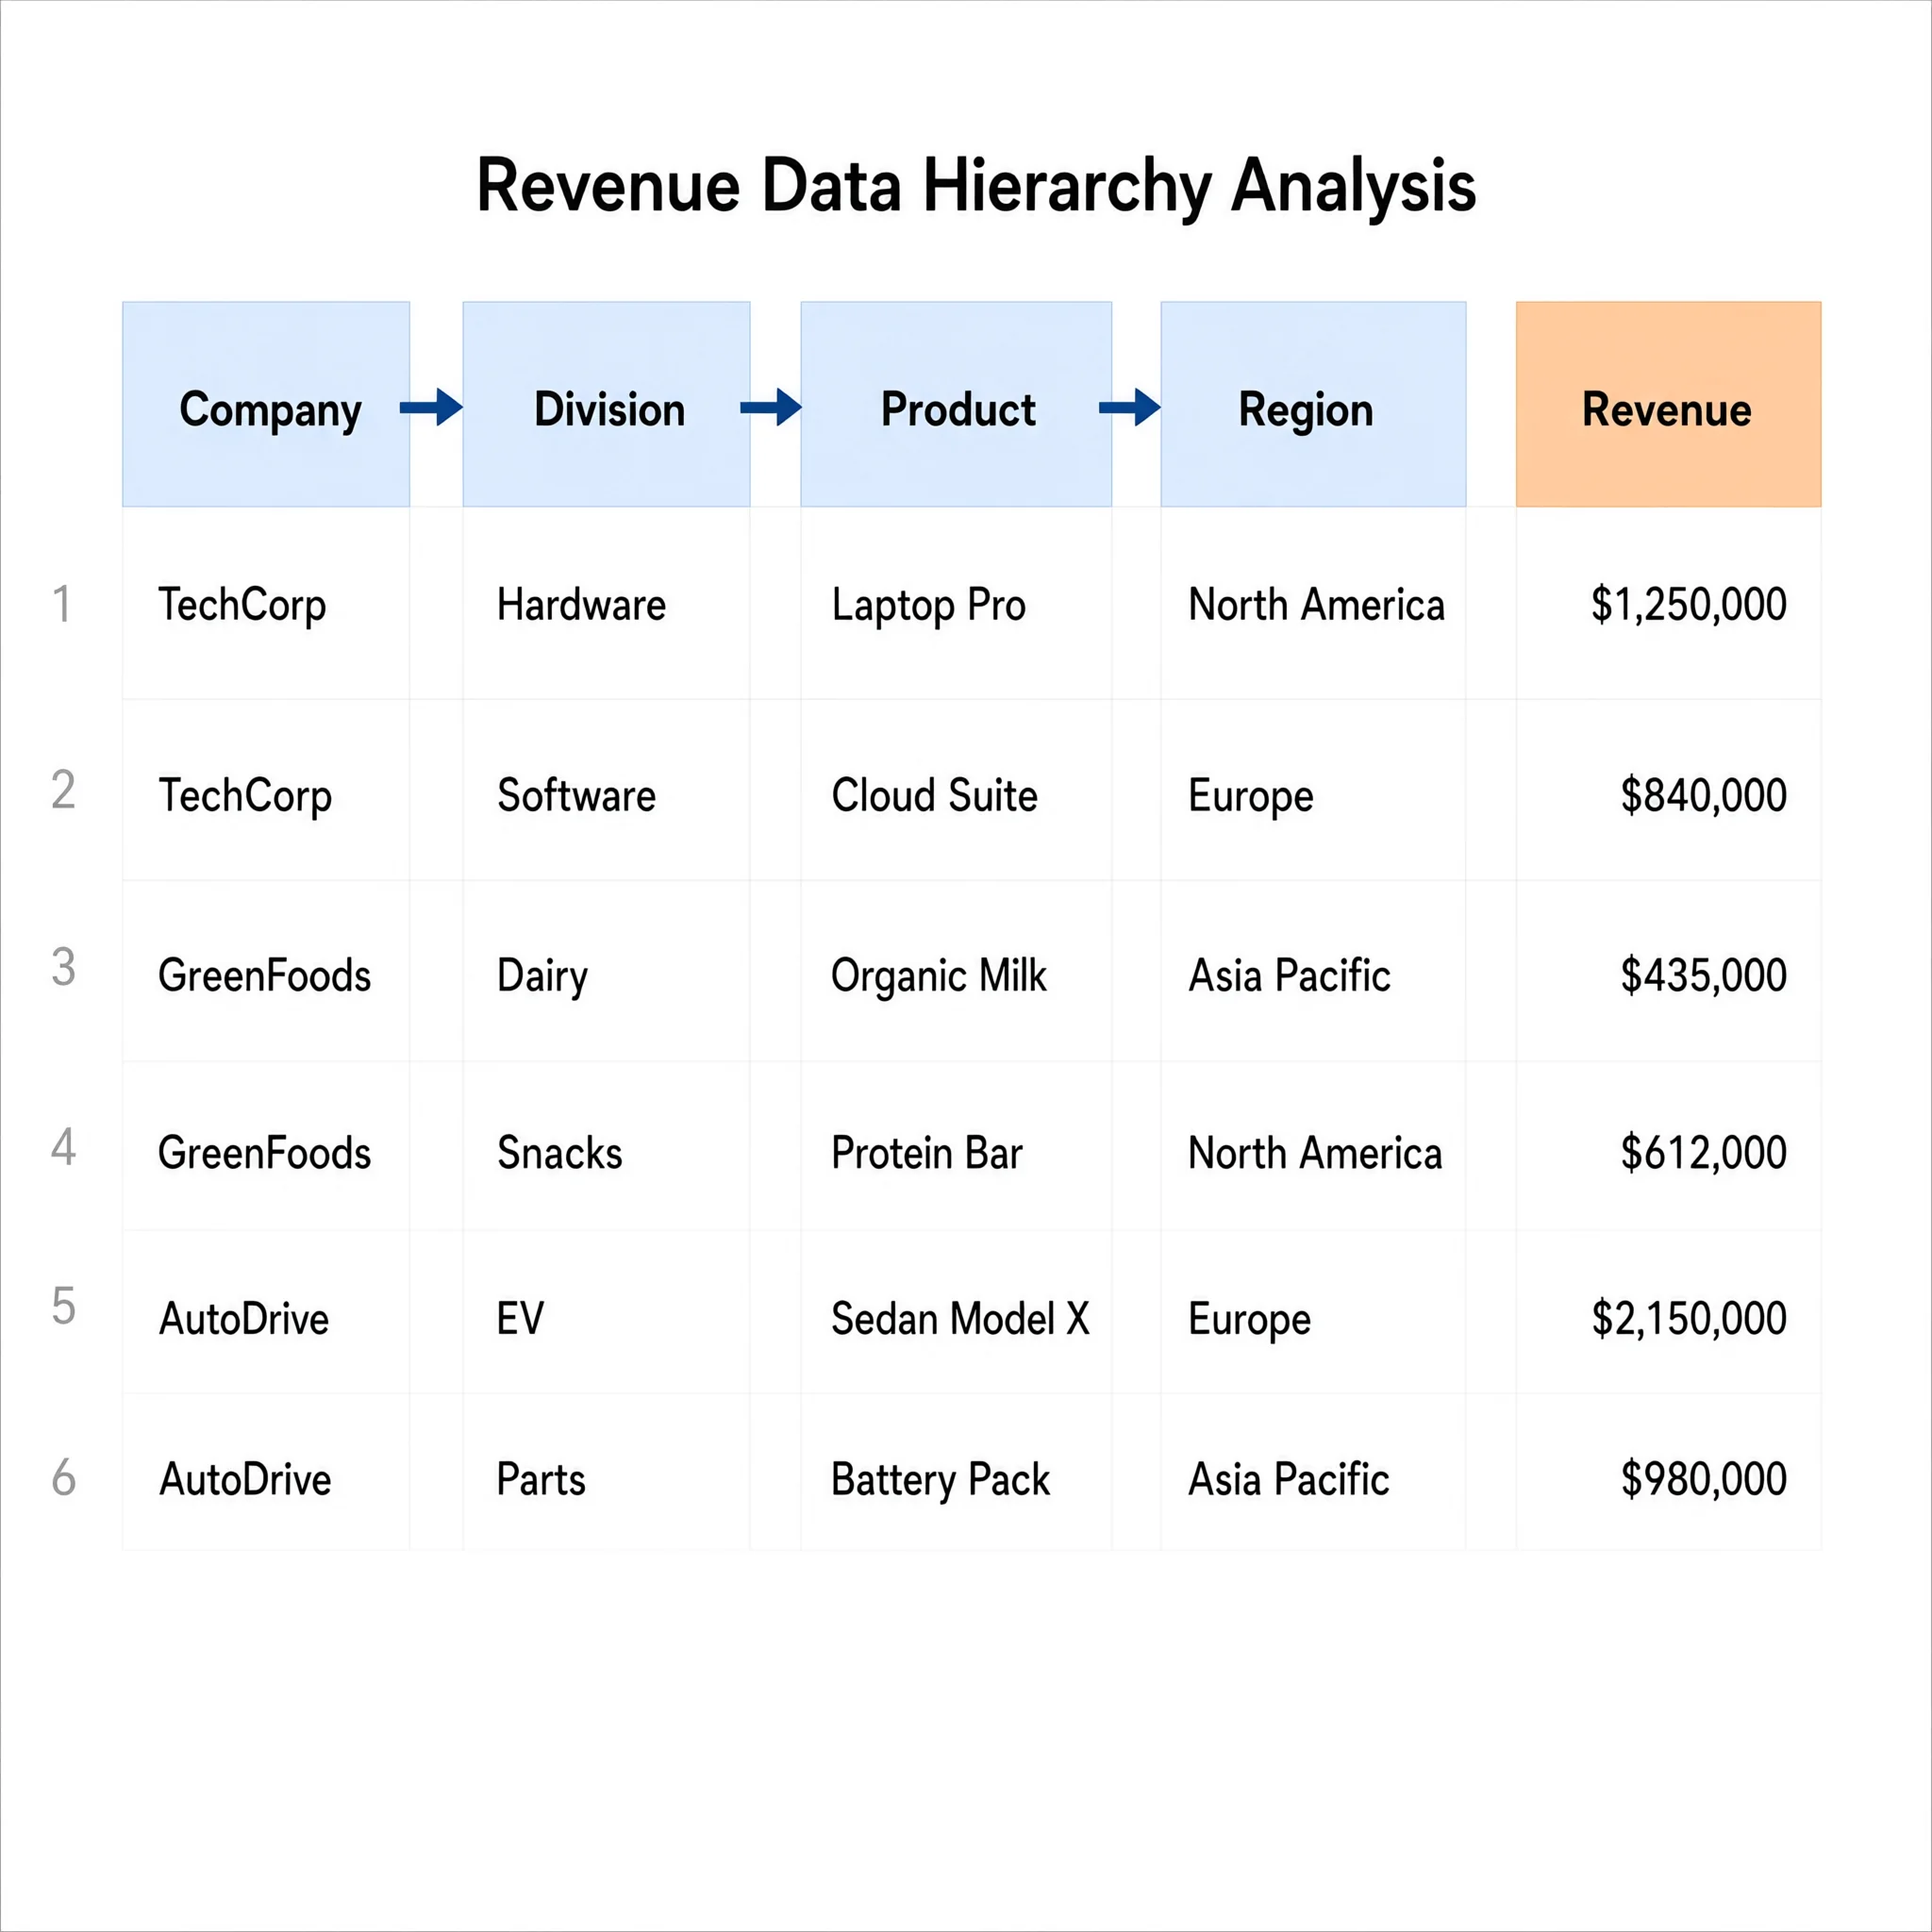
Four columns, not two
The dataset has company, division, product, and region, plus a revenue figure for each row. Pick just two of those, say division and product, and you'd get a perfectly valid flow. You'd also lose which company each division belongs to, and you'd lose where in the world the revenue actually came from. Nothing about the data itself is wrong. You just quietly threw away two-thirds of the structure that was sitting right there in the file.
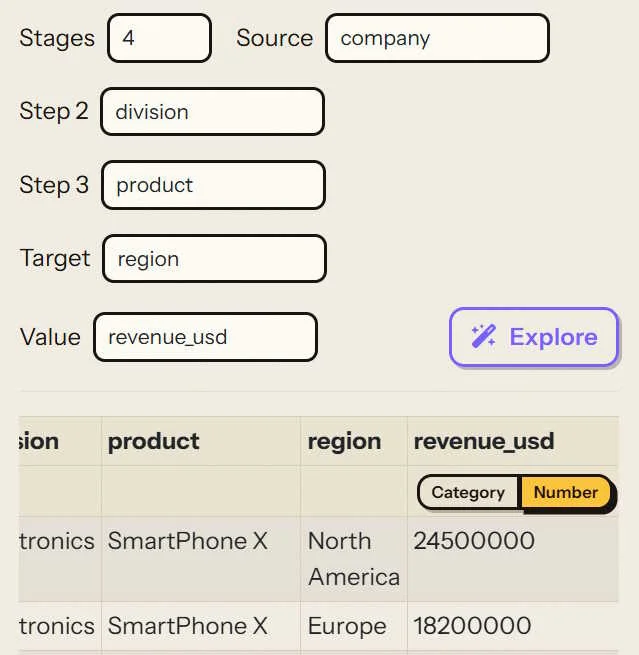
Stages: choosing how many columns to chain
The Data tab's Stages control is where you decide how many of those columns actually go into the flow, from two up to five. Pick four, and you get a Source, two Step columns in between, and a Target, each one a dropdown you assign to any column in your file. Company as the source, division and product as the two steps, region as the target, and you've told the tool to walk the whole chain instead of collapsing it down to one hop.
What "chaining" actually means underneath
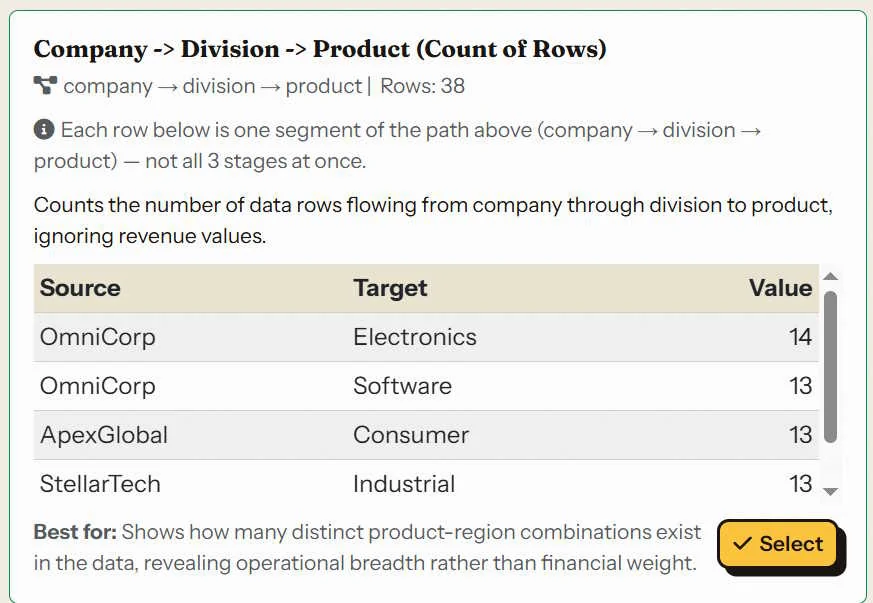
Here's the part worth being precise about, because it's not as exotic as it sounds: a four-stage flow isn't a new kind of data structure. It's three separate Source/Target/Value aggregations, run back to back and pooled together.
Company to Division gets summed on its own. Division to Product gets summed on its own. Product to Region gets summed on its own. Each of those is exactly the same Source/Target/Value shape you'd get from a plain two-column flow, just computed independently for each consecutive pair in the chain, then combined into one flow that happens to have more than one layer in it.
Follow it through with real numbers. OmniCorp's Electronics division has four products sold across four regions:
- Company → Division: OmniCorp → Electronics sums every Electronics row regardless of product or region: $114.2M
- Division → Product: Electronics → SmartPhone X sums that one product across every region it's sold in: $68.7M
- Product → Region: SmartPhone X → North America is already at row-level granularity, so it's just that row's own value: $24.5M
Same revenue column the entire way through. Three different totals, because each stage pair is aggregating at a different level of grouping, from "everything under this division" down to "this exact product in this exact region."
Order changes what the flow says
Because each hop only ever aggregates the two columns next to it, the order you put the stages in changes what the flow actually communicates, not just how it looks. Company → Division → Product → Region reads as "here's how the business breaks down, from the whole company down to a single product in a single market." Flip it to Region → Product → Division → Company and you'd be reading it backward, starting from geography and rolling everything up into one company-wide total by the last hop. Neither is wrong, they're just answering different questions, and the broad-to-narrow order is usually the one that reads naturally on a slide.
If you'd rather not choose the exact order yourself, that's what Explore is for. Point it at a file with several category columns and it proposes a few different chains, already aggregated, so you can compare a couple of orderings before committing to one.
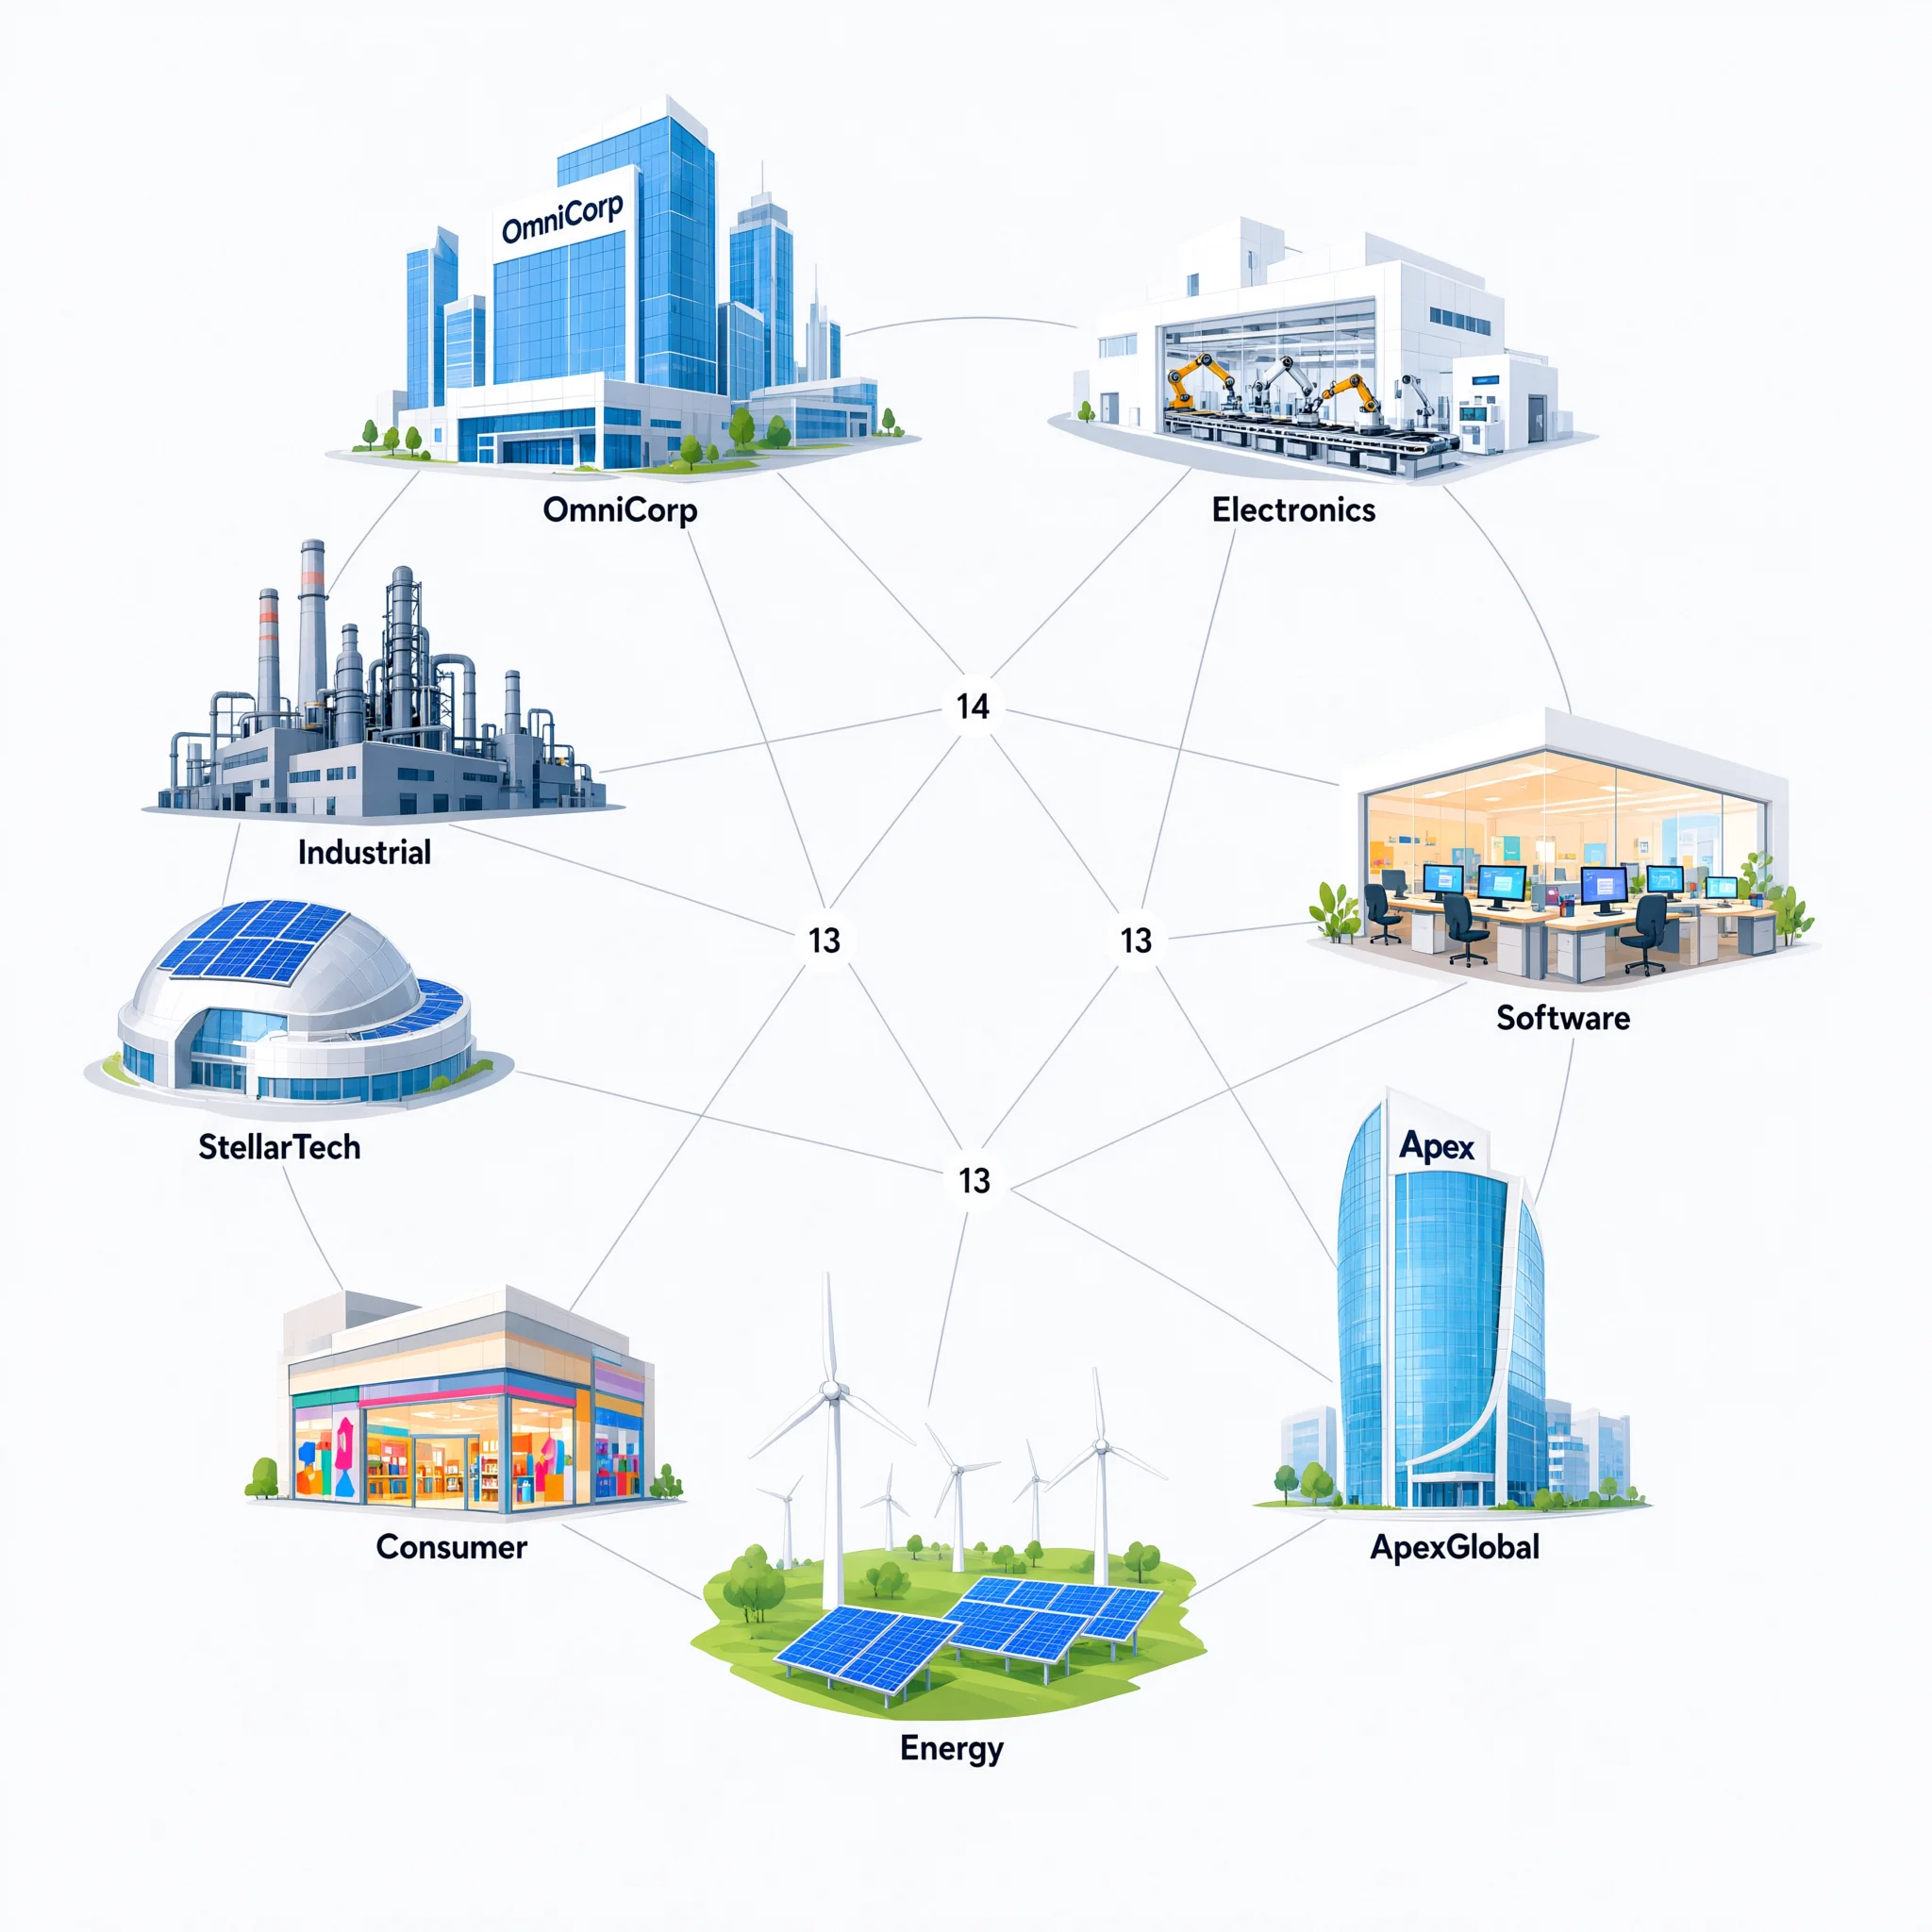
Slide Notes: This overview shows all our key partners and the flow of value between them. OmniCorp and ApexGlobal are major sources, while StellarTech also contributes significantly. The numbers indicate the magnitude of each flow, with most values around 13 or 14.
The following is the Overview slide based on results in the Data tab. I had the tool select the Top 5 results from our 4 stages.
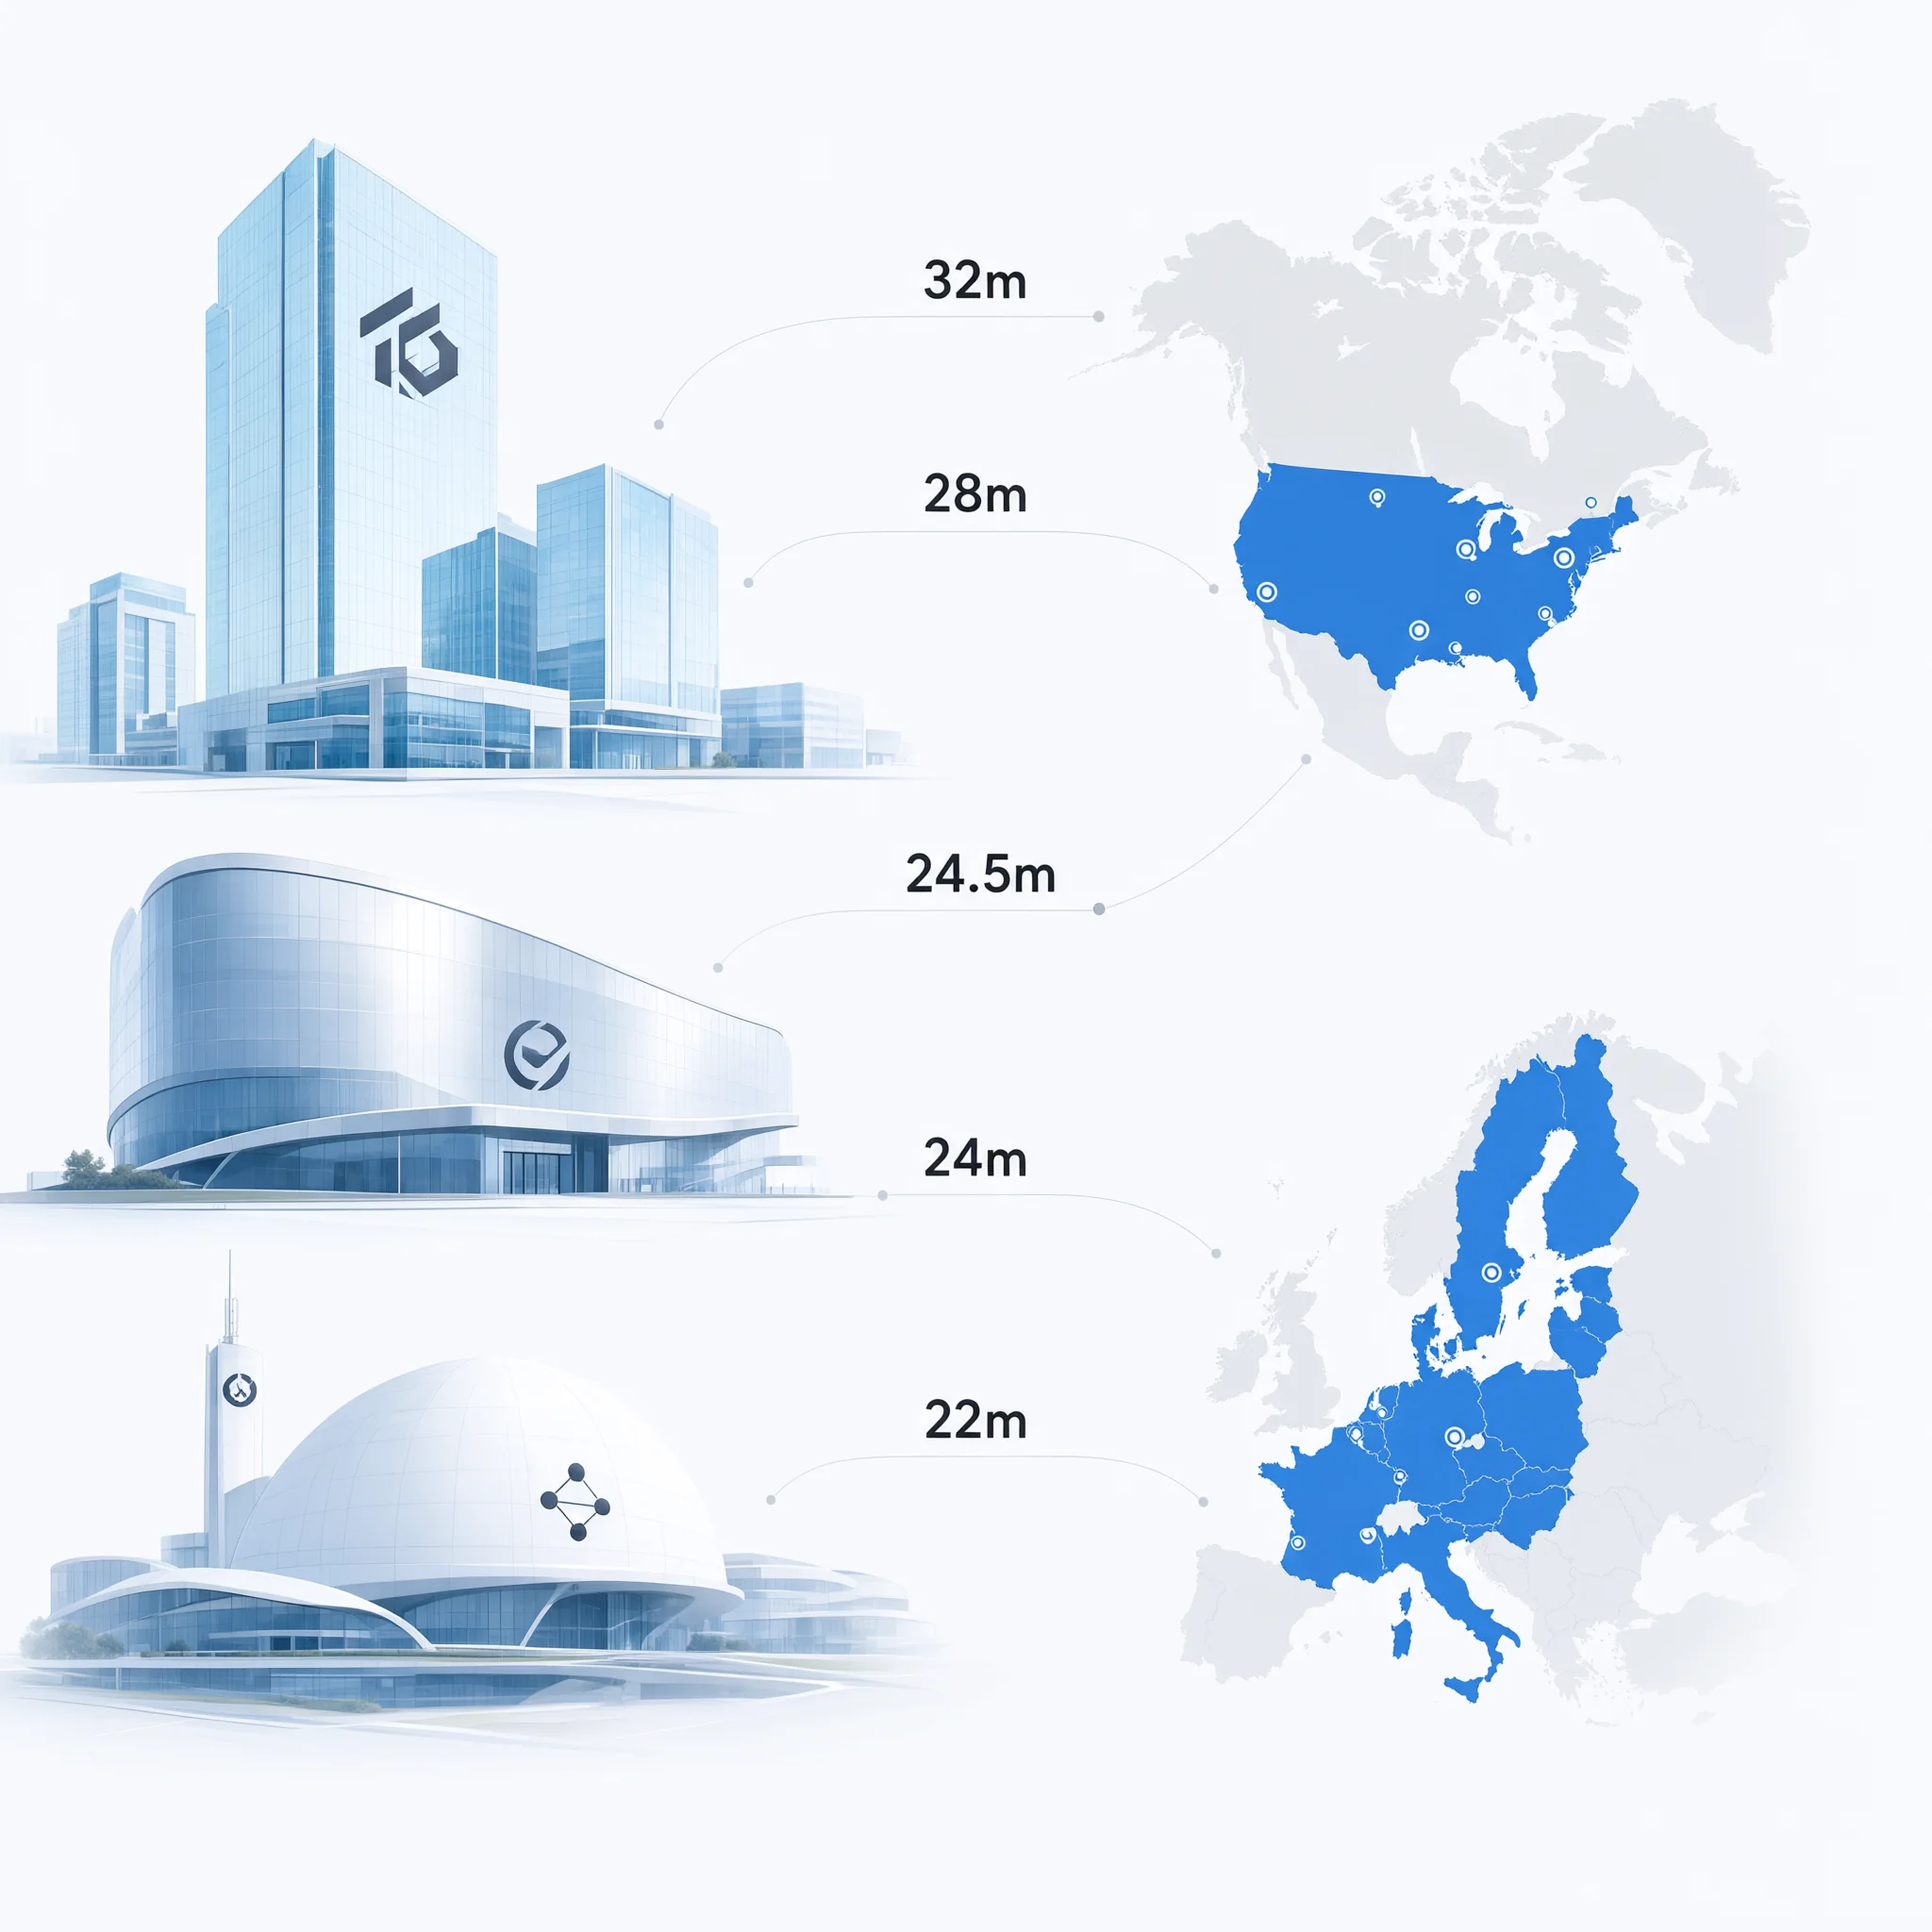
Slide Notes: This overview shows the flow of revenue from our corporate entities into the North American and European regions. OmniCorp is the largest contributor, with multiple flows into North America totaling over 80 million. ApexGlobal and StellarTech also contribute significantly to North America, while Europe receives a substantial 24 million from OmniCorp.
And here is the first slide:
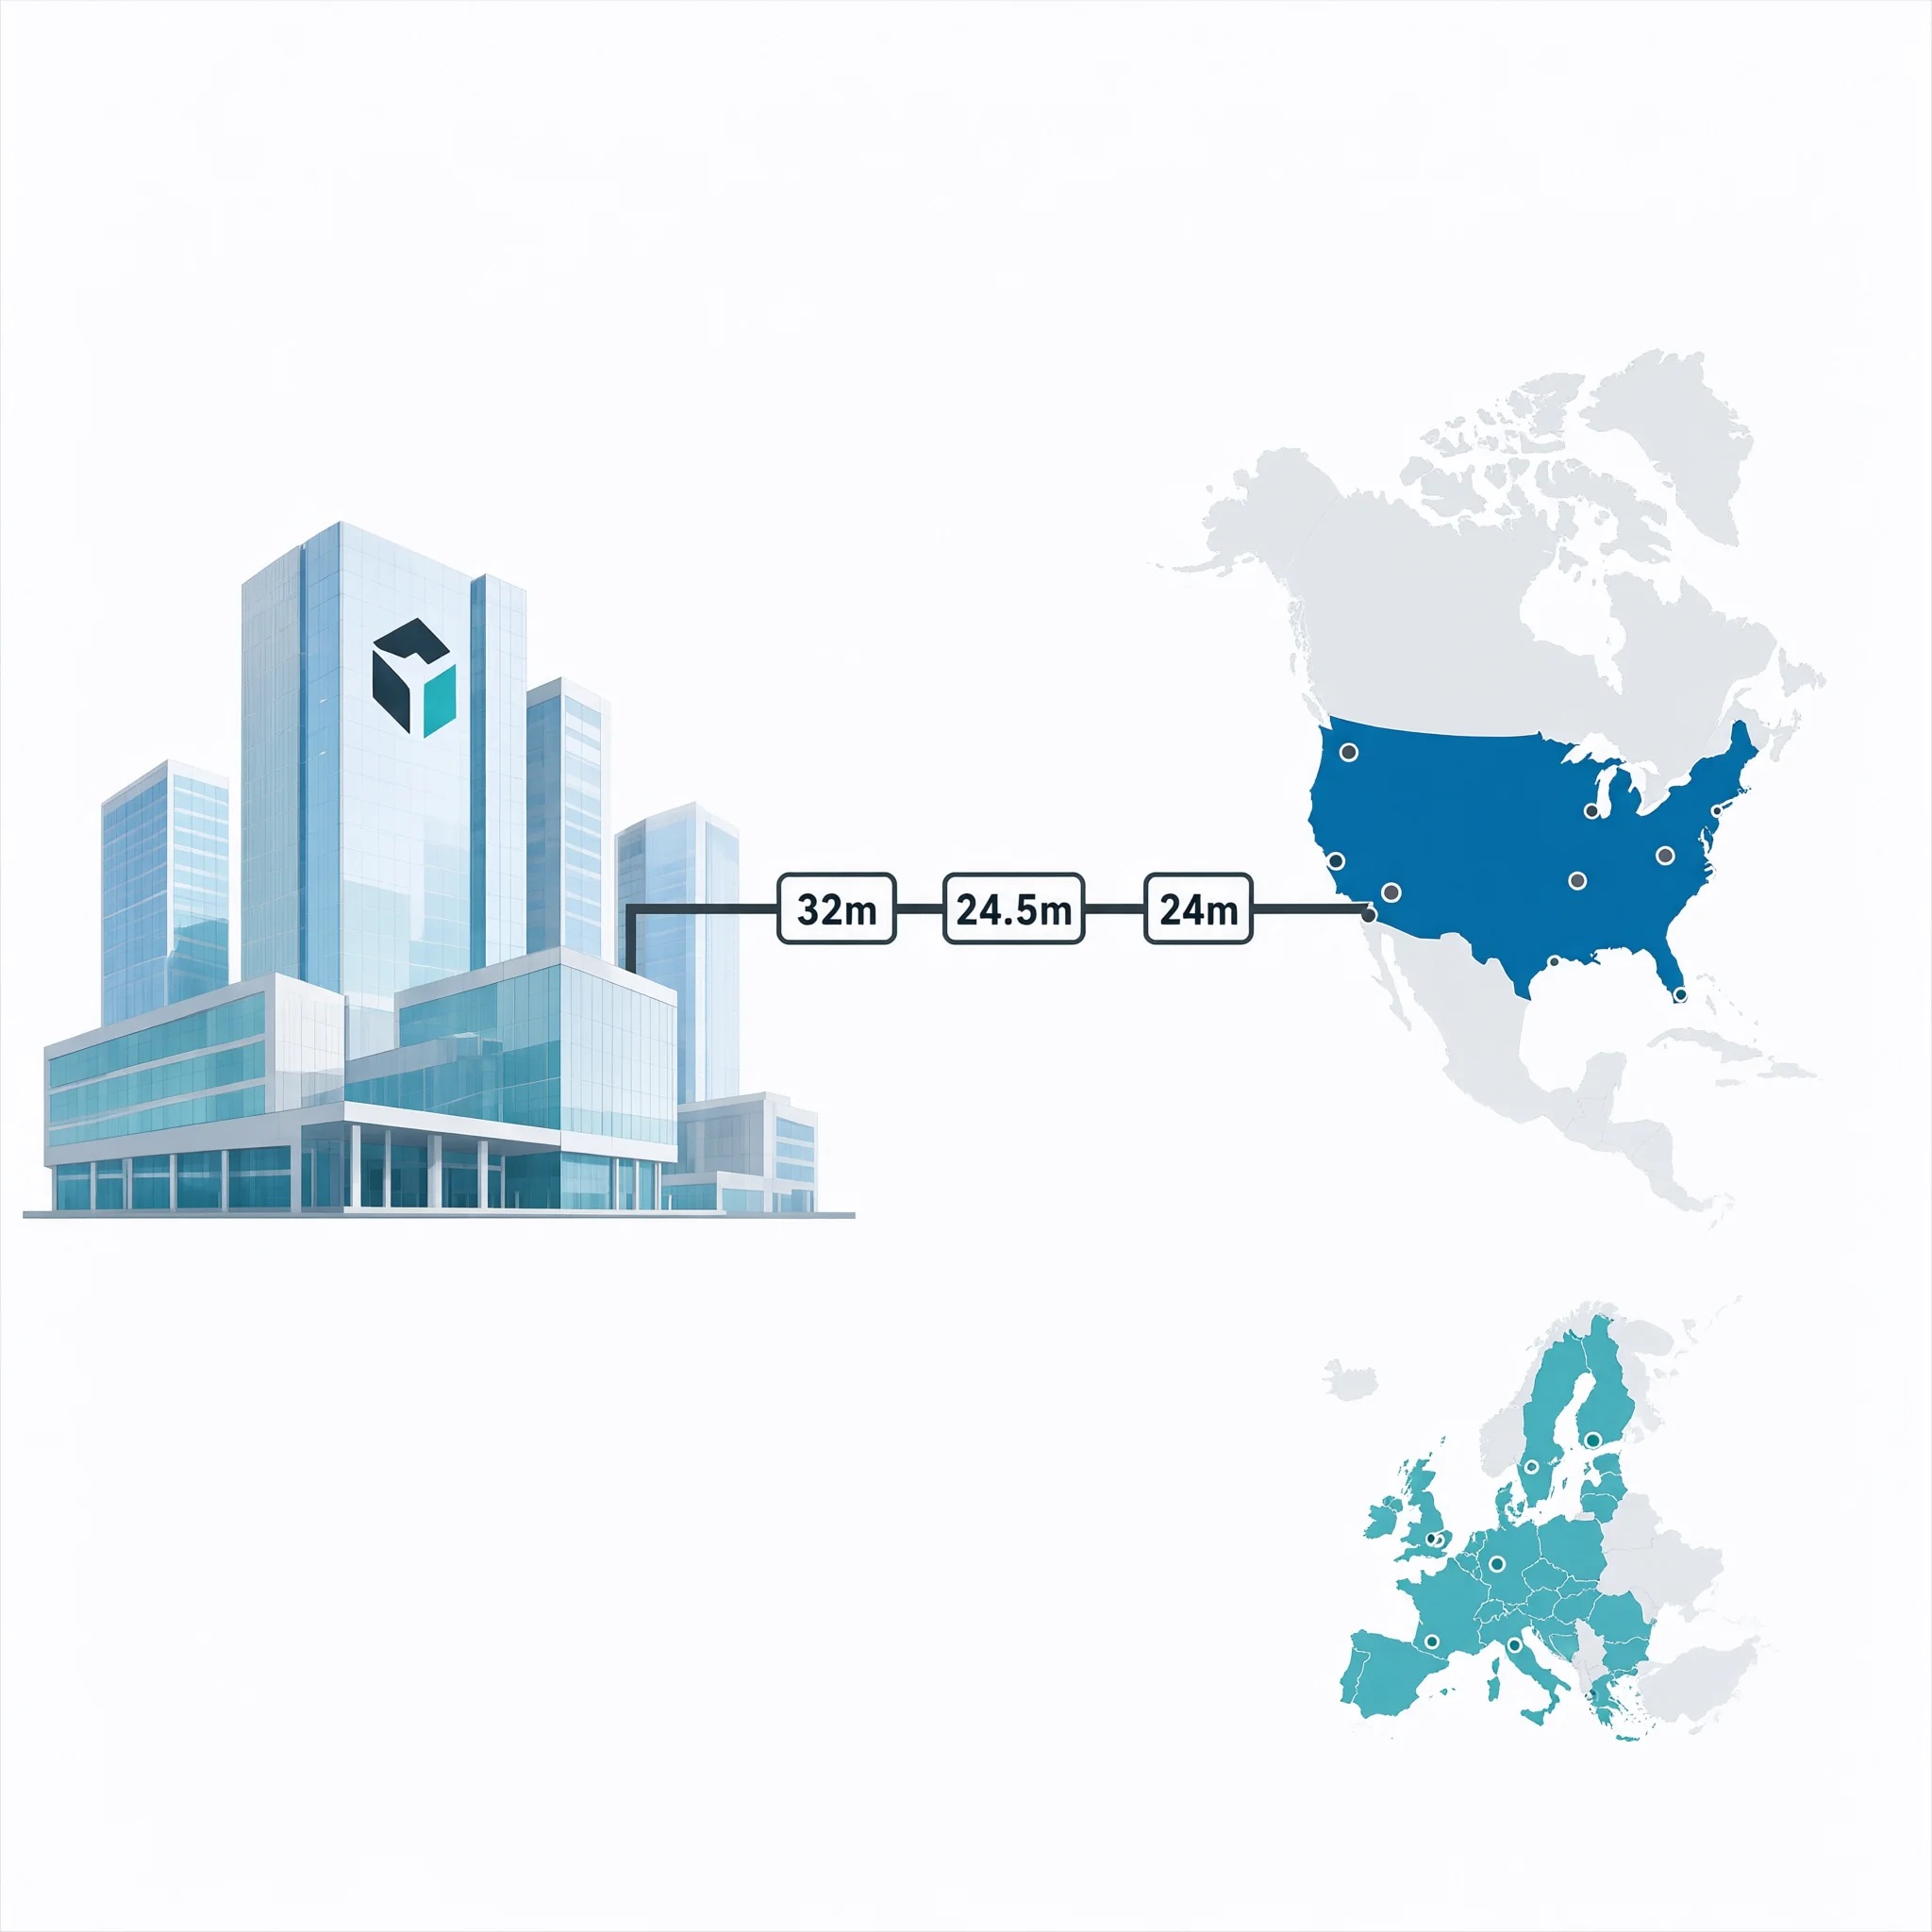
Slide Notes: Here we see OmniCorp's revenue flows into North America. There are three separate contributions: 32 million, 24.5 million, and 24 million. Combined, these make OmniCorp the largest source of revenue for the region.
Notice the consistency between the characters (variables) defined in the Overview slide and how they carry over into the first slide in a presentation.
And here is the second and final slide in the deck:
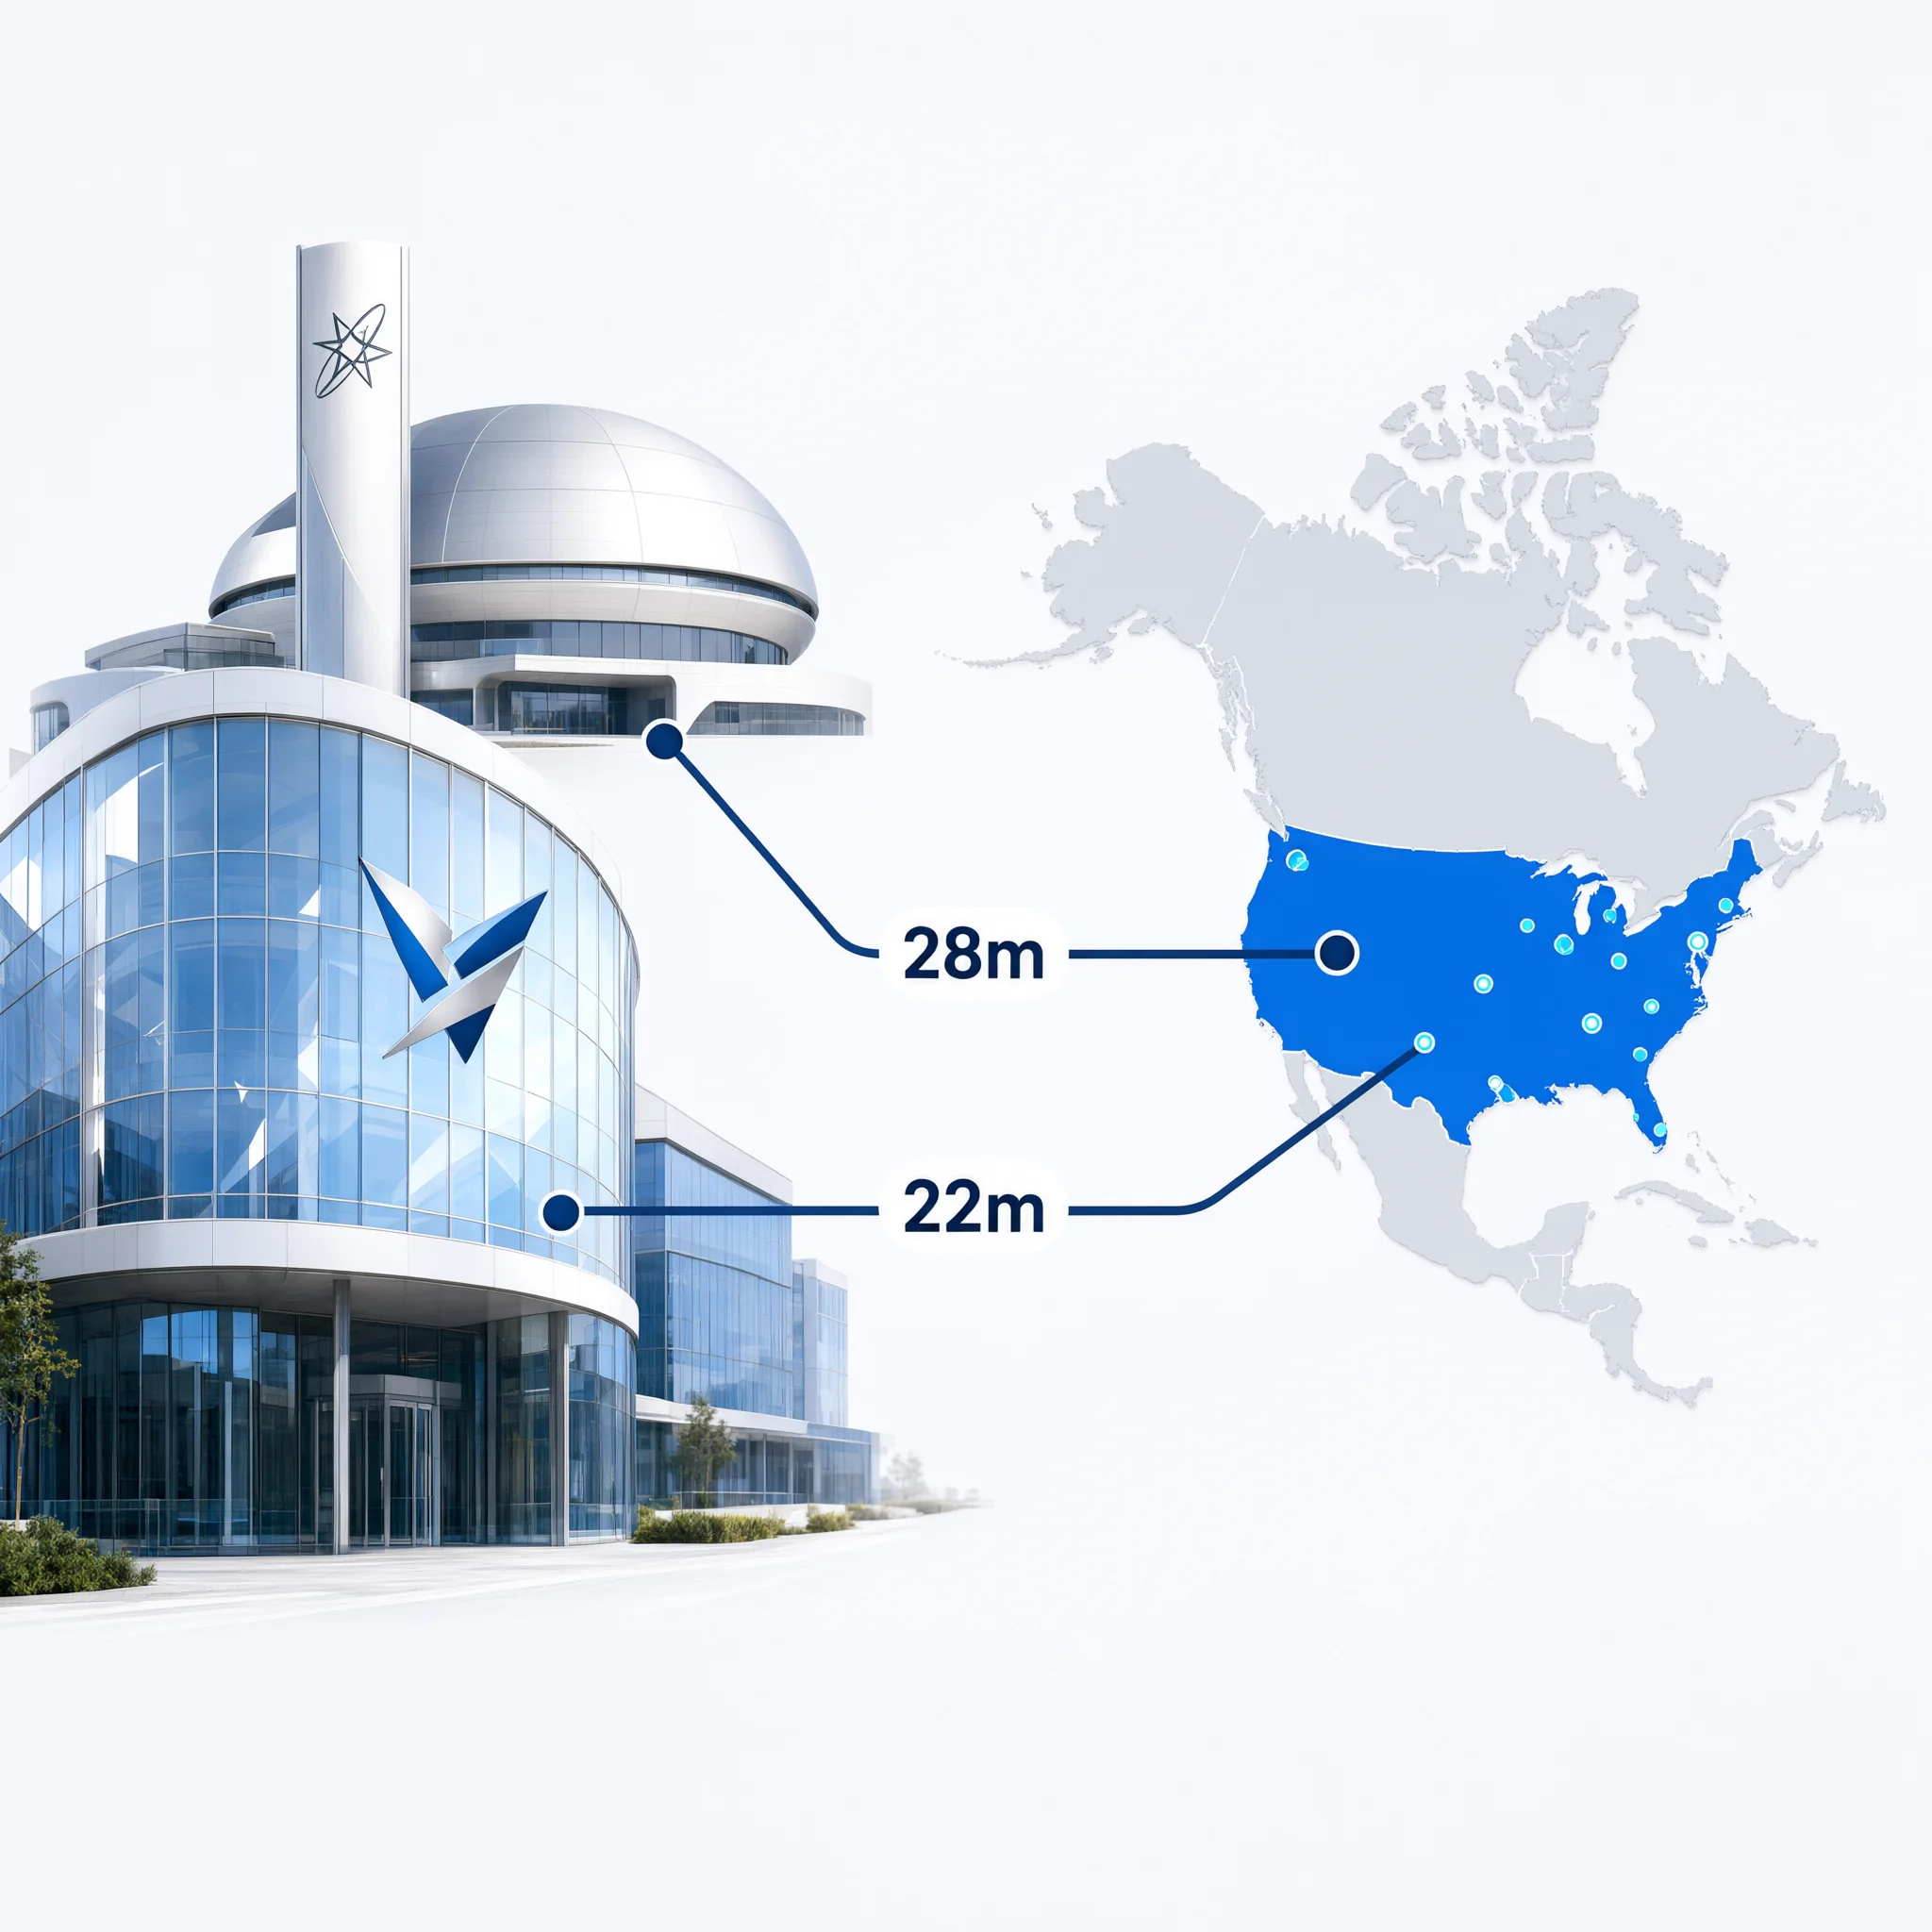
Slide Notes: This slide shows the other two contributors to North America. ApexGlobal contributes 28 million, and StellarTech contributes 22 million. Together, they add 50 million to the region, but still less than OmniCorp's total contribution.
The takeaway
A flow with five stages isn't a different kind of thing than a flow with two. It's the same Source, Target, Value idea, computed once for every pair of columns you chain together, stacked into a single result. The number of stages you pick is really just a question of how much of your data's real structure you want to keep versus how much you're willing to collapse away.
Try it with your own data
If your file has more than two columns that matter, this is worth testing on it directly: try it with two stages, then at three or four, and see how much of the story shows up.
Discussion