From Campaign Chaos to Clear Visuals: Turning Marketing Data into Actionable Stories
We see it every day. A campaign performance report. A quarterly marketing review. An email from the CMO asking for "a quick look at the numbers." And with it comes the data: impressions, clicks, conversions, CAC, ROAS, attribution models.
If you're in marketing, you know the feeling. You open the dashboard. Your eyes glaze over. You know the data is there. But the insight? It's buried in 14 tabs and 3 pivot tables.
As a highly visual person, I keep asking myself: why do we continue to present campaign data in ways that are so hard to parse? The answer is simple: turning columns of numbers into a clear narrative is genuinely difficult.
But what if we could transpose those numbers (and their column headers) into a picture? A picture is worth a thousand words. And in marketing, those words could mean a budget reallocation that doubles your ROI.
The Challenge: Storytelling in a Data-Driven World
Marketing has a dirty secret: we generate more data than we can actually use. And the data we do use is often presented in ways that obscure the story.
-
Channel managers want to know: "Is Facebook or TikTok driving more conversions?"
-
Content teams want to know: "Which assets are resonating?"
-
The C-Suite wants to know: "Is our marketing spend actually working?"
One dashboard cannot serve all these needs. But a visual story? That can.
The Solution: Turning Funnel Data into a Visual Journey
I built a tool specifically to address this challenge. Here's how it works:
-
Upload any CSV of marketing data: campaign performance, funnel metrics, customer acquisition costs, you name it. Even just two columns is enough.
-
Hit Explore, and the AI generates multiple data "flows," pivoting your data into optional datasets you can choose from.
-
Pick a dataset, select a visual style, and click Visualize.
Here's the magic. The AI analyzes the variables in your data and creates a unique character for each one. Think of them as mini prompts that give personality to your numbers. It weaves those characters into a prompt that generates a full Slide Deck based on your dataset.
The result? A set of text-to-image prompts, each with locked-in characters for consistency across slides. Drop those prompts into your favorite paid AI image generator, and watch your marketing data come to life.
Before: The Overwhelming Dashboard View
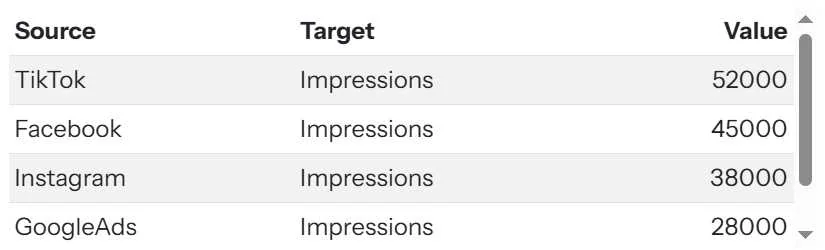
This is the data. Important, but it's a list of numbers, not a story.
After: The Visual Campaign Story

This is the story. Which channel is winning? Now you can see it in seconds.
Which one is more intuitive: the chart or the image? Let us know in the comments.
The Power of Consistency: Character-Driven Storytelling
Notice how the AI creates consistent characters for each data variable. This is crucial for marketing communication. That was the overview slide, this is the first slide/flow in the presentation.
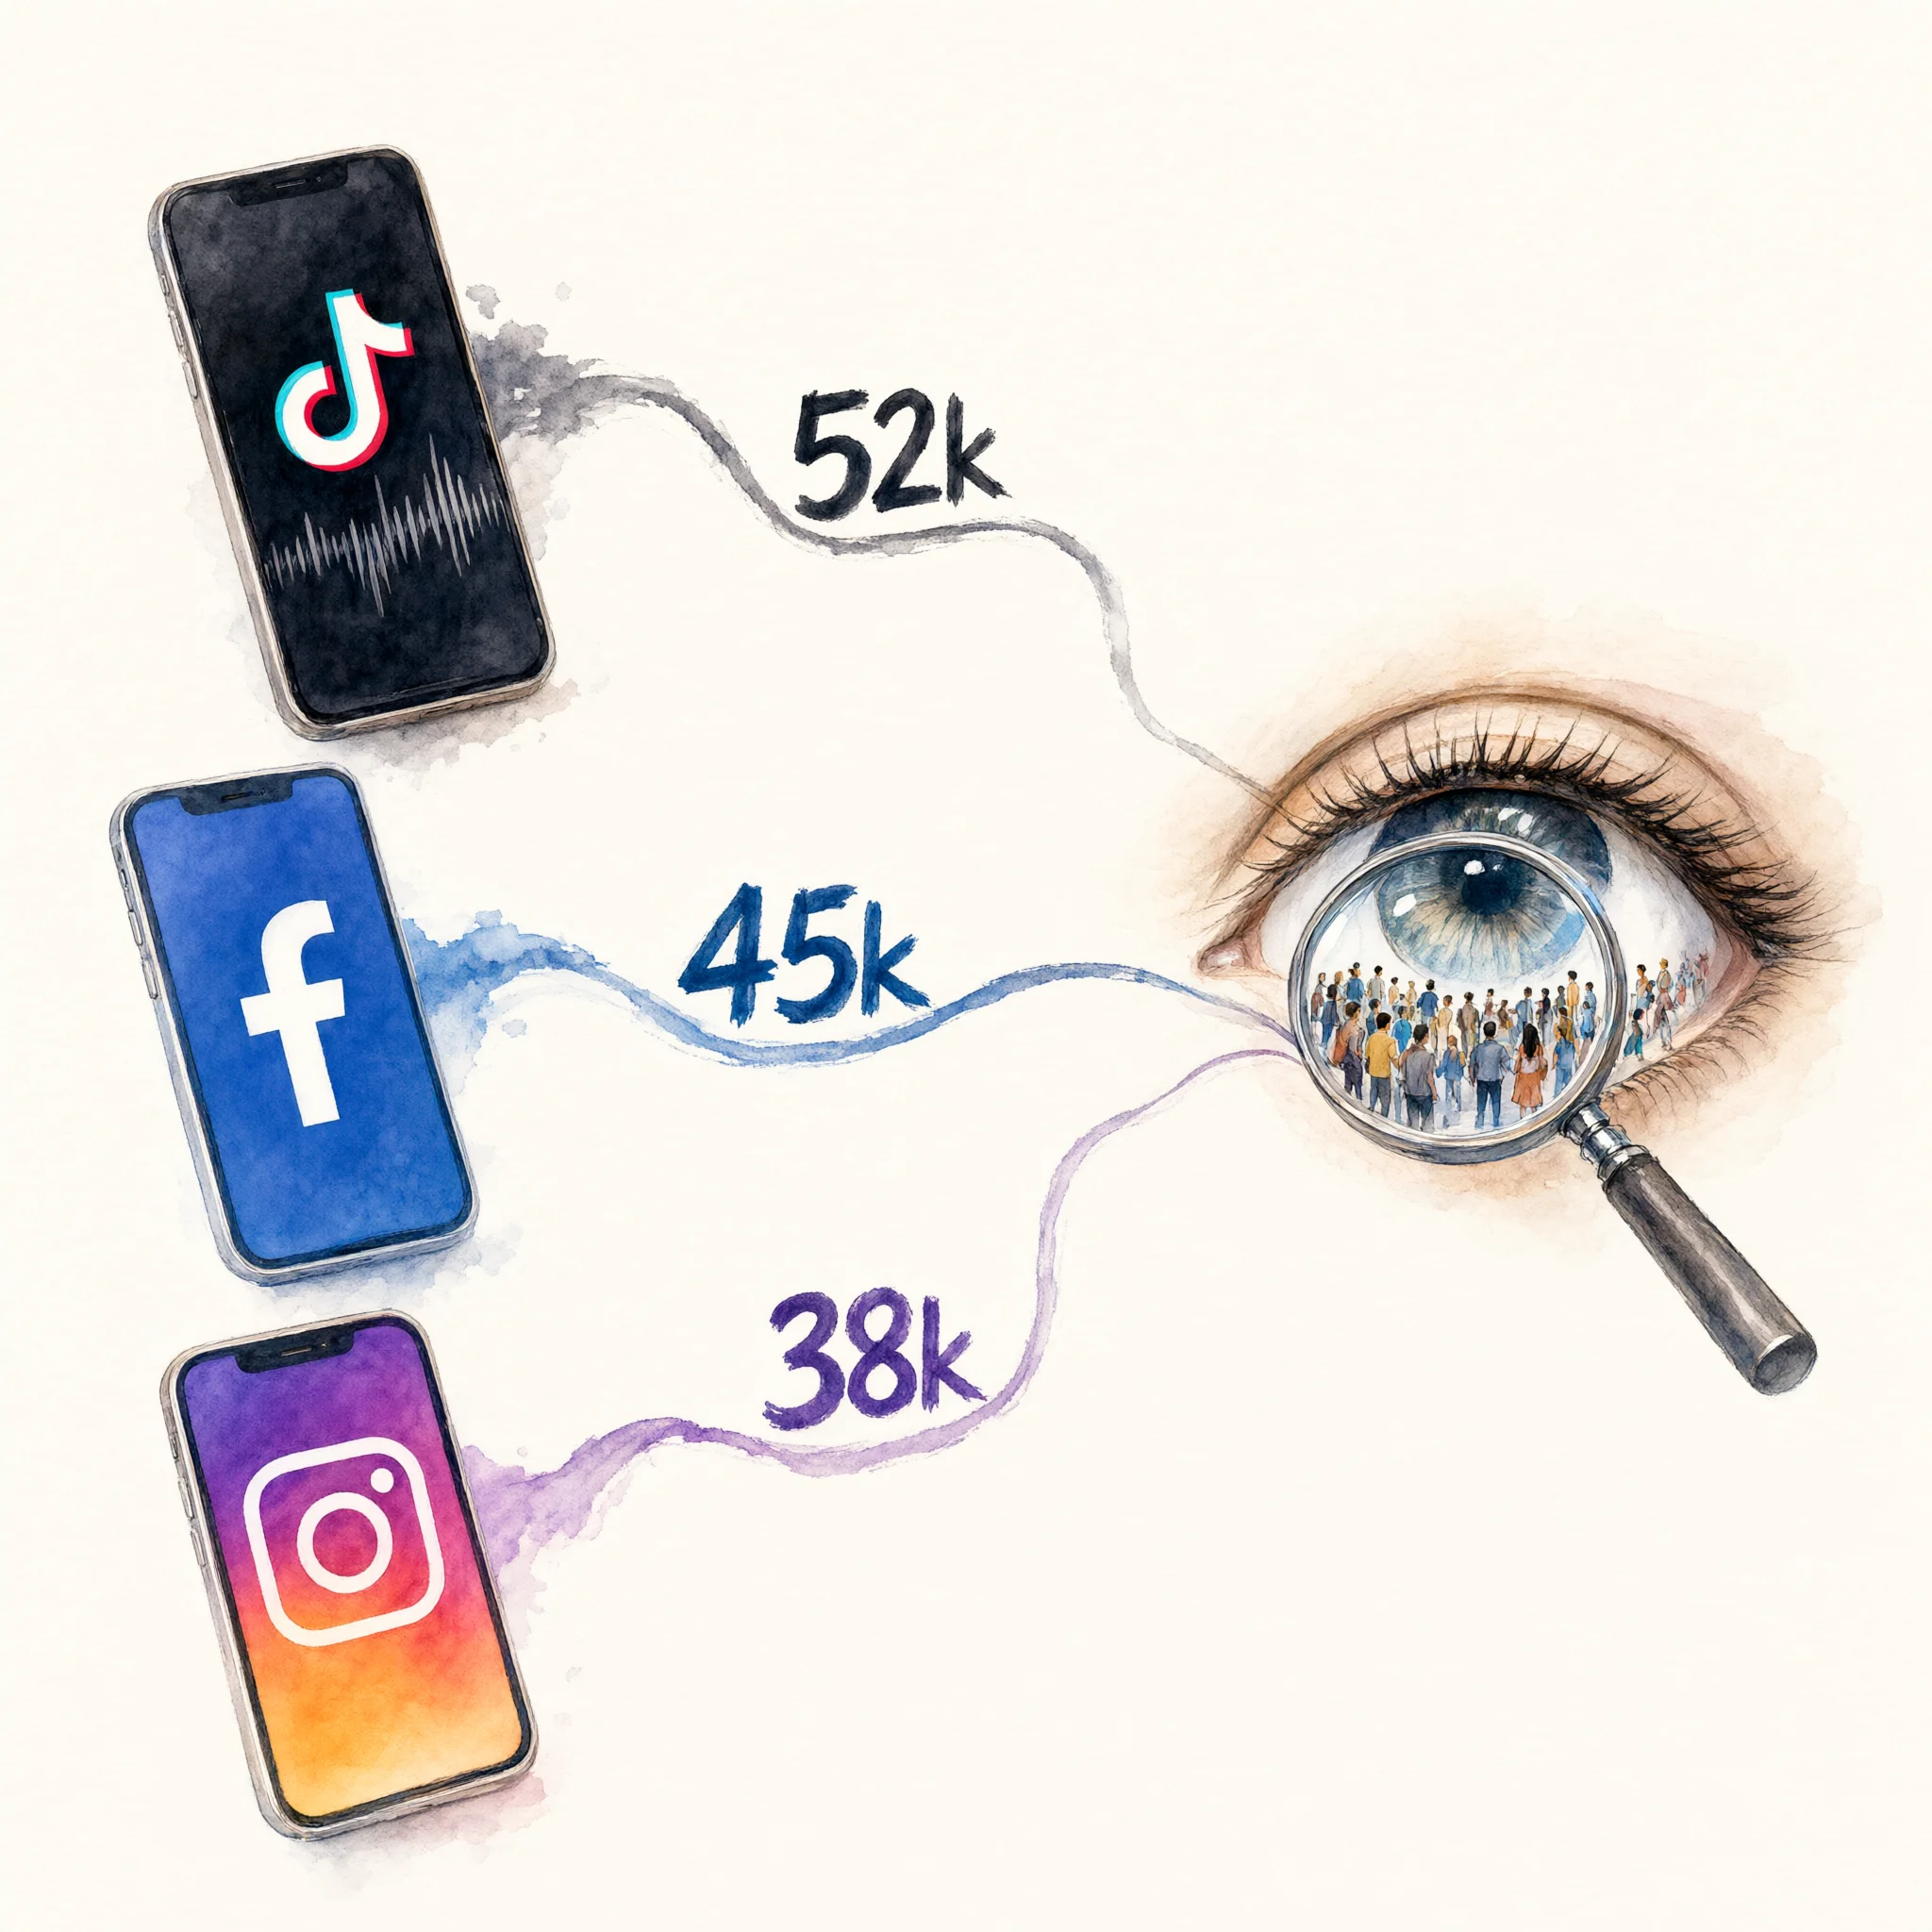
Consistent characters across slides build a narrative. Your team and stakeholders learn to "read" the characters.
What This Means for Marketing Professionals
For marketers, analysts, and agency owners, this tool is about making your data immediately actionable.
For Marketing Managers: You can now turn a confusing monthly report into a 5-minute visual debrief that actually drives conversation.
For Agency Owners: You can show clients their campaign results in a way that proves your value and builds trust.
For Content Creators: You can turn your audience data into visual stories that make your Substack or blog posts more shareable and memorable.
For the Broader Marketing Community: The Variable Voices Community is already exploring how this approach can transform everything from social media reporting to brand tracking studies.
Your Turn
Think about the last campaign review, quarterly report, or client presentation you had to deliver. Could a visual have helped you make your point faster?
Discussion