Beyond the Spreadsheet: Turning Financial Data into Board-Ready Visual Stories
We see it every day. The quarterly report. The P&L statement. The investor presentation. And with it comes the data: revenue, expenses, profit margins, EBITDA, cash flow, and 47 other metrics that all start to blur together.
If you work in finance, you know the feeling. You've spent weeks compiling the numbers. You know the story is there. But when you present to the board or your clients, you see their eyes glaze over. They're looking at a wall of spreadsheets, not a compelling narrative.
As a visual thinker, I keep asking myself: why do we continue to present financial data in ways that are so hard to absorb? The answer is simple: turning columns of numbers into a persuasive story is genuinely difficult.
But what if you could transpose those numbers (and their column headers) into a picture? A picture is worth a thousand words. And in finance, those words could mean a faster investment decision, a better board vote, or a clearer path to profitability.
The Challenge: Clarity in a World of Complexity
Financial professionals face a unique communication challenge. You need to:
-
Present complex data accurately
-
Tell a clear story about performance and strategy
-
Persuade stakeholders to act
-
Do all of this in a way that's accessible to non-finance experts on the board
Traditional charts work, but they don't always tell the full story. And they rarely build a narrative.
The Solution: Turning Financial Data into a Visual Journey
I built a tool specifically to address this challenge. Here's how it works:
-
Upload any CSV of financial data: P&L statements, quarterly performance, budget vs. actuals, you name it. Even just two columns is enough.
-
Hit Explore, and the AI generates multiple data "flows," pivoting your data into optional datasets you can choose from.
-
Pick a dataset, select a visual style, and click Visualize.
Here's the magic. The AI analyzes the variables in your data and creates a unique character for each one. Think of them as mini prompts that give personality to your numbers. It weaves those characters into a prompt that generates a full Slide Deck based on your dataset.
The result? A set of text-to-image prompts, each with locked-in characters for consistency across slides. Drop those prompts into your favorite paid AI image generator, and watch your financial data come to life.
Before: The Standard Financial Table
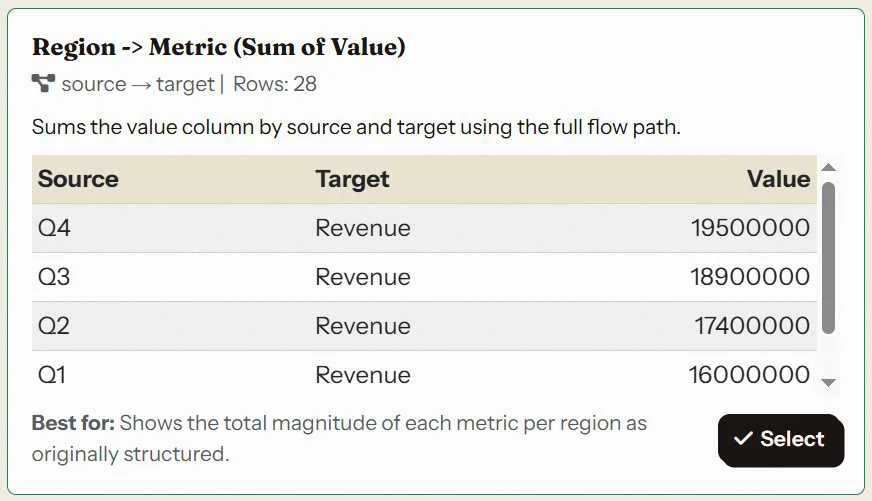
Caption: This is the data. Important, but it's a list of numbers, not a story.
After: The Visual Financial Narrative

This is the story. Now your board can see which divisions are thriving and which need attention.
Slide Notes: This overview shows our revenue streams for the year. Each quarter contributes progressively, from Q1 at 16 million to Q4 at 19.5 million, and Asia Pacific adds 5.2 million on top. The next slides break these flows down in detail.
Which one is more intuitive: the chart or the image? Let us know in the comments.
The Power of Consistency: Character-Driven Storytelling
Notice how the AI creates consistent characters for each data variable. This is crucial for financial communication.

Consistent characters across slides build a narrative. Your stakeholders learn to "read" the characters.
Slide Notes: Here we see the quarterly contributions to revenue. Q1 is the smallest at 16 million, and each quarter grows, with Q4 leading at 19.5 million. The upward trend is clear across the year.
What This Means for Finance Professionals
For CFOs, finance managers, and investment professionals, this tool is about making your data more persuasive.
For Finance Managers: You can now turn a confusing quarterly report into a 10-minute visual presentation that actually drives conversation.
For CFOs: You can present to the board in a way that builds confidence and speeds up decision-making.
For Investment Professionals: You can show clients their portfolio performance in a way that proves value and builds trust.
For Accounting Firms: You can deliver client reports that are not just accurate, but also engaging and easy to understand.
Check out what the Variable Voices Community has built so far, and consider how this approach could change how you present your next financial review.
Your Turn
Think about the last quarterly report, board presentation, or client review you had to deliver. Could a visual have helped you make your case more effectively?
Discussion