From Press Release to Picture: How Journalists Can Turn Data into Visual Stories in Minutes
We see it every day. A press release lands in your inbox. A government report drops. An economic indicator is released. And with it comes the data: tables of numbers, percentages, and margins of error.
If you're a journalist, you know the feeling. You know there's a story in there. But the clock is ticking. Your deadline is approaching. And you're staring at a spreadsheet that looks like alphabet soup.
As a visual thinker, I keep asking myself: why do we continue to present data-heavy stories in ways that are so hard for readers to digest? The answer is simple: turning columns of numbers into a compelling narrative is genuinely difficult, especially under deadline pressure.
But what if you could transpose those numbers (and their column headers) into a picture? A picture is worth a thousand words. And in journalism, those words could mean the difference between a story that gets read and a story that gets scrolled past.
The Challenge: Data Literacy in a Fast-Paced News Environment
Journalists face a unique data challenge. You need to:
-
Understand the data quickly
-
Identify the story within the numbers
-
Present it in a way that's accurate and engaging
-
Do all of this before your competitor publishes
Traditional charts work, but they take time to create and don't always tell the full story. What if you could generate a visual narrative in minutes instead of hours?
The Solution: Turning Data into Shareable Visual Narratives
I built a tool specifically to address this challenge. Here's how it works:
-
Upload any CSV of news data: election results, economic indicators, public health statistics, you name it. Even just two columns is enough.
-
Hit Explore, and the AI generates multiple data "flows," pivoting your data into optional datasets you can choose from.
-
Pick a dataset, select a visual style, and click Visualize.
Here's the magic. The AI analyzes the variables in your data and creates a unique character for each one. Think of them as mini prompts that give personality to your numbers. It weaves those characters into a prompt that generates a full Slide Deck based on your dataset.
The result? A set of text-to-image prompts, each with locked-in characters for consistency across slides. Drop those prompts into your favorite paid AI image generator, and watch your data story come to life.
Before: The Press Release Table
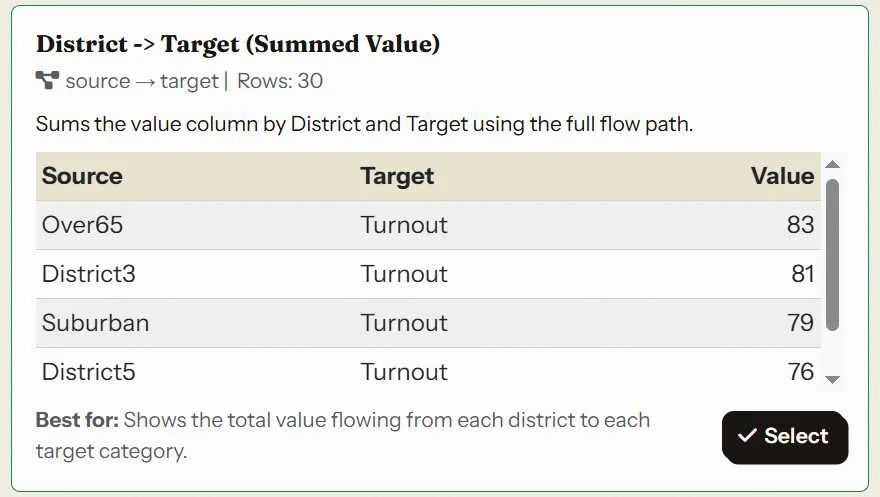
This is the raw data. Important, but it's not a story yet.
After: The Visual News Story
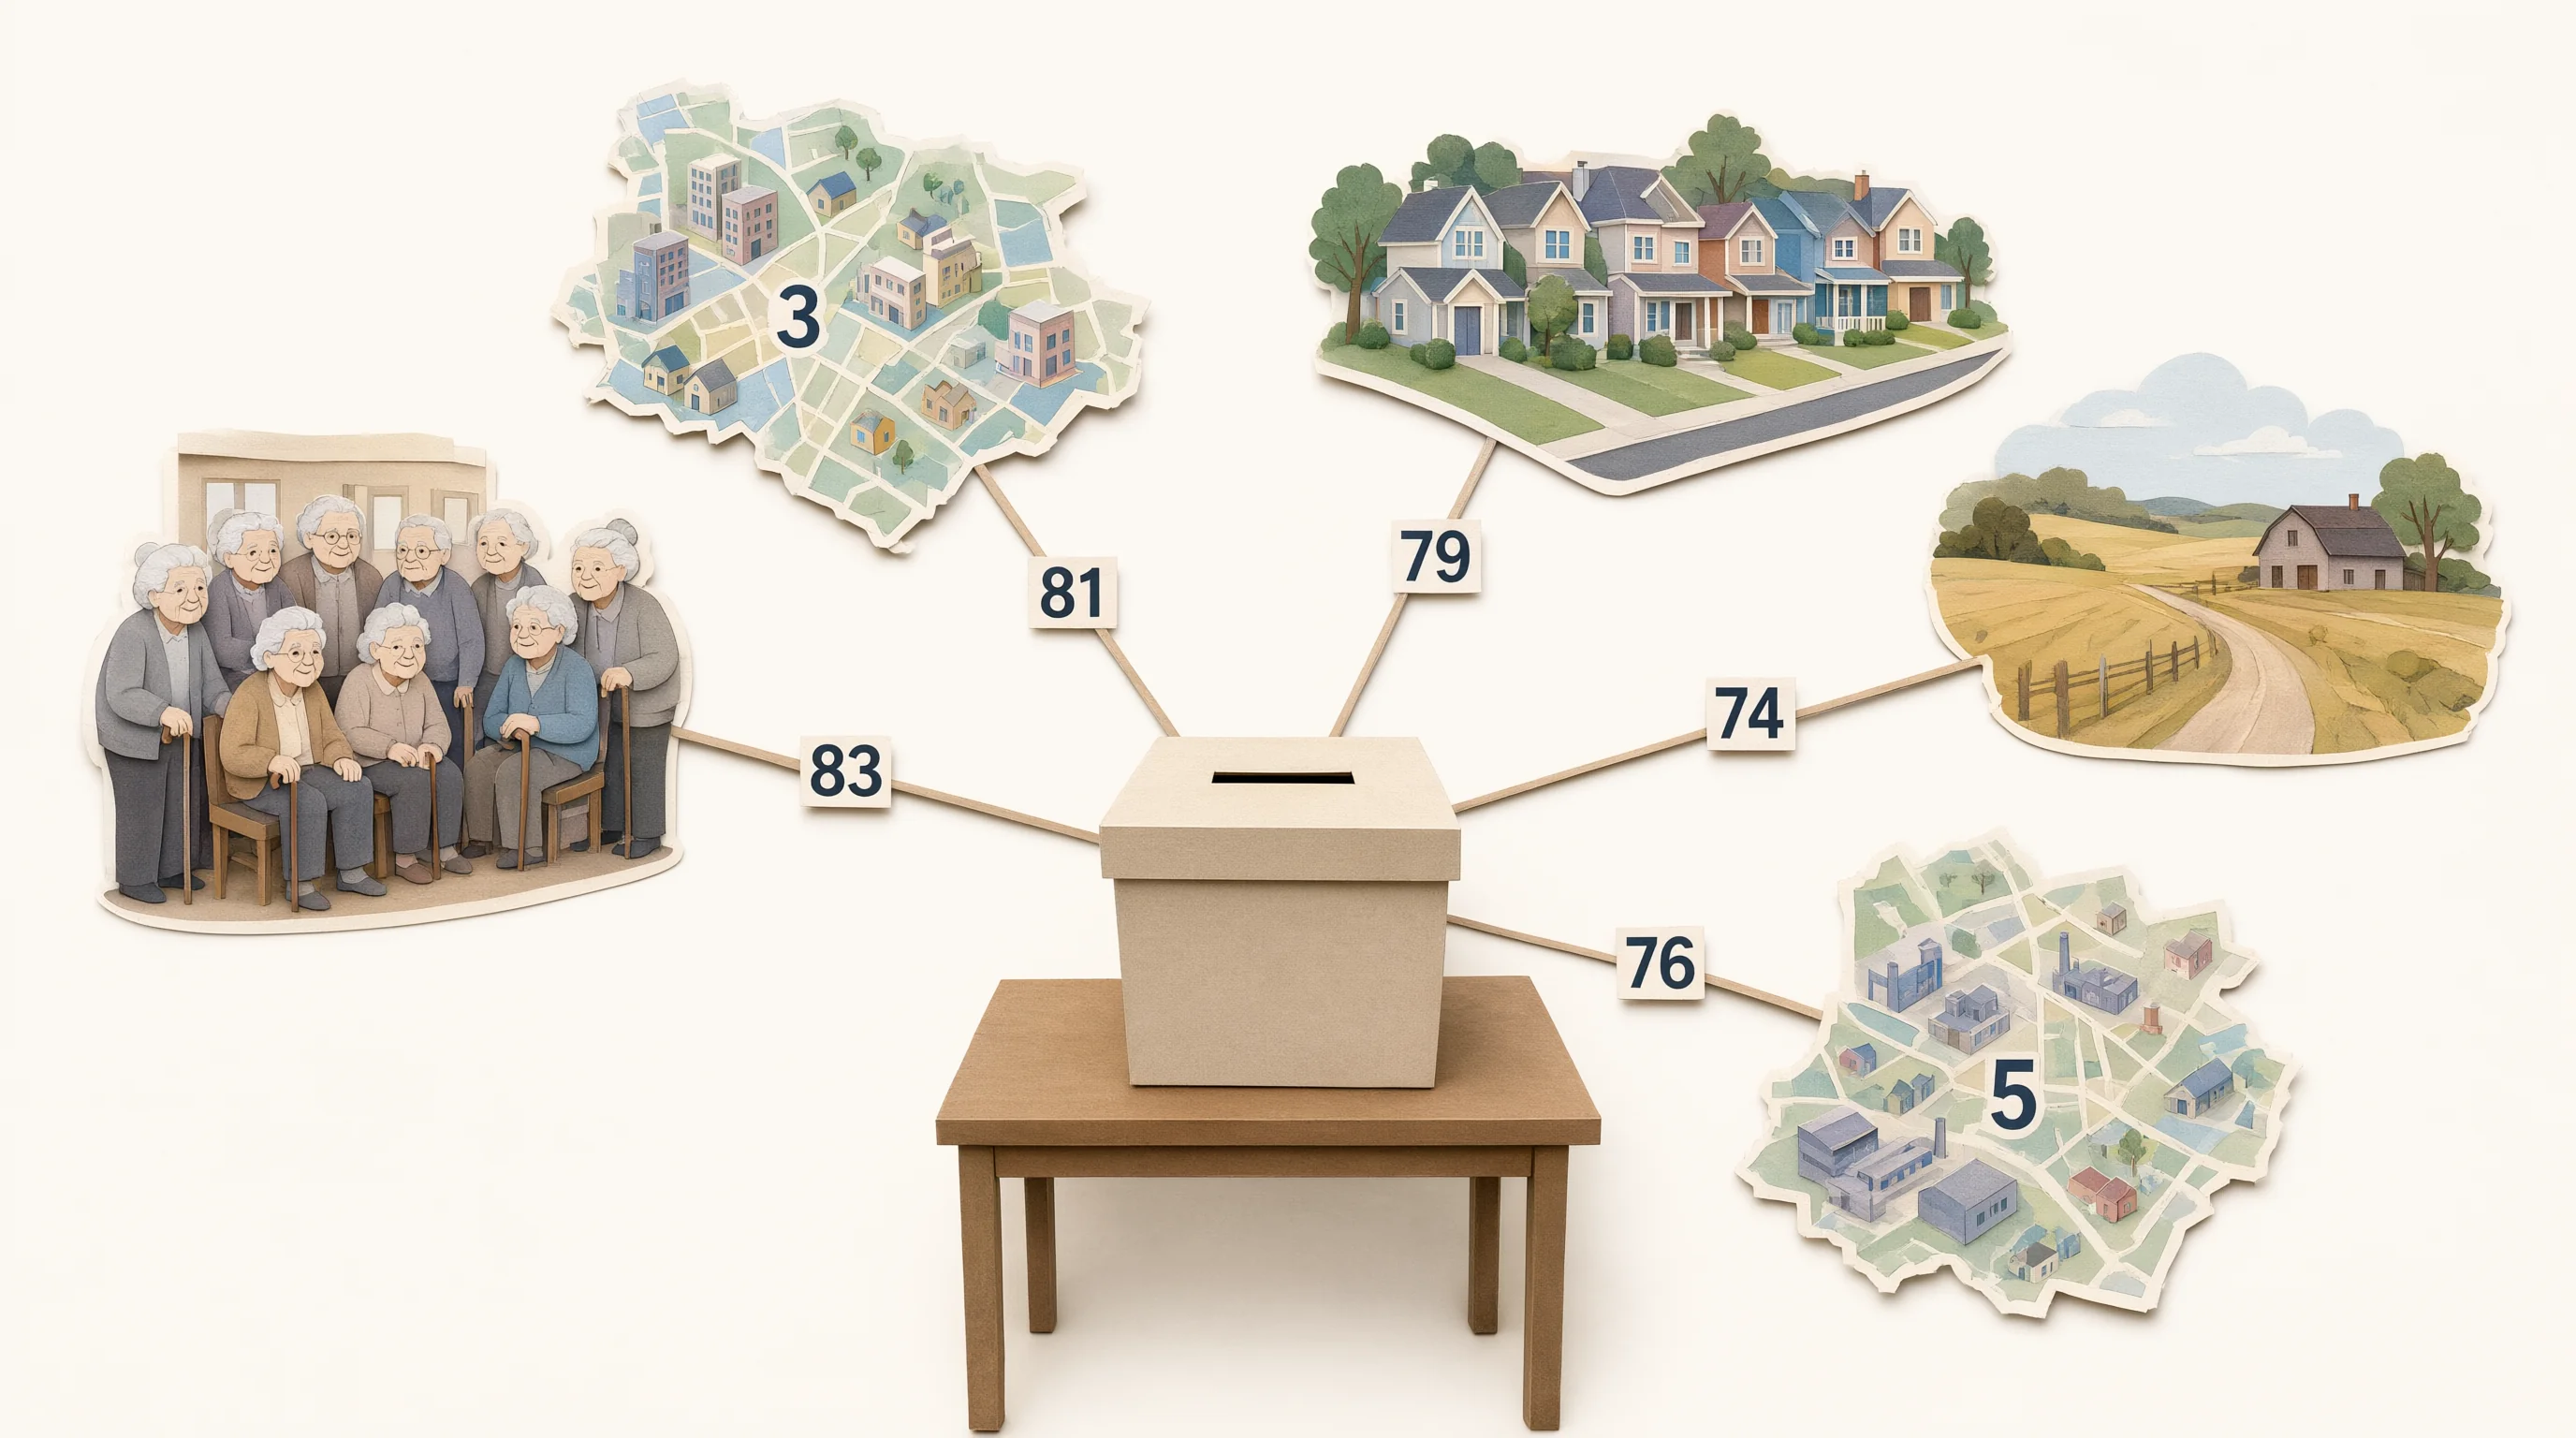
This is the story. Now your readers can see the trend in seconds.
Slide Notes: his is the overall picture of voter turnout across our key segments and districts. The elderly population shows the highest turnout at 83%, followed closely by District 3 at 81% and suburban areas at 79%. District 5 and rural areas trail slightly at 76% and 74%, respectively.
Which one is more intuitive: the chart or the image? Let us know in the comments.
The Power of Consistency: Character-Driven Storytelling
Notice how the AI creates consistent characters for each data variable. This is crucial for journalism.
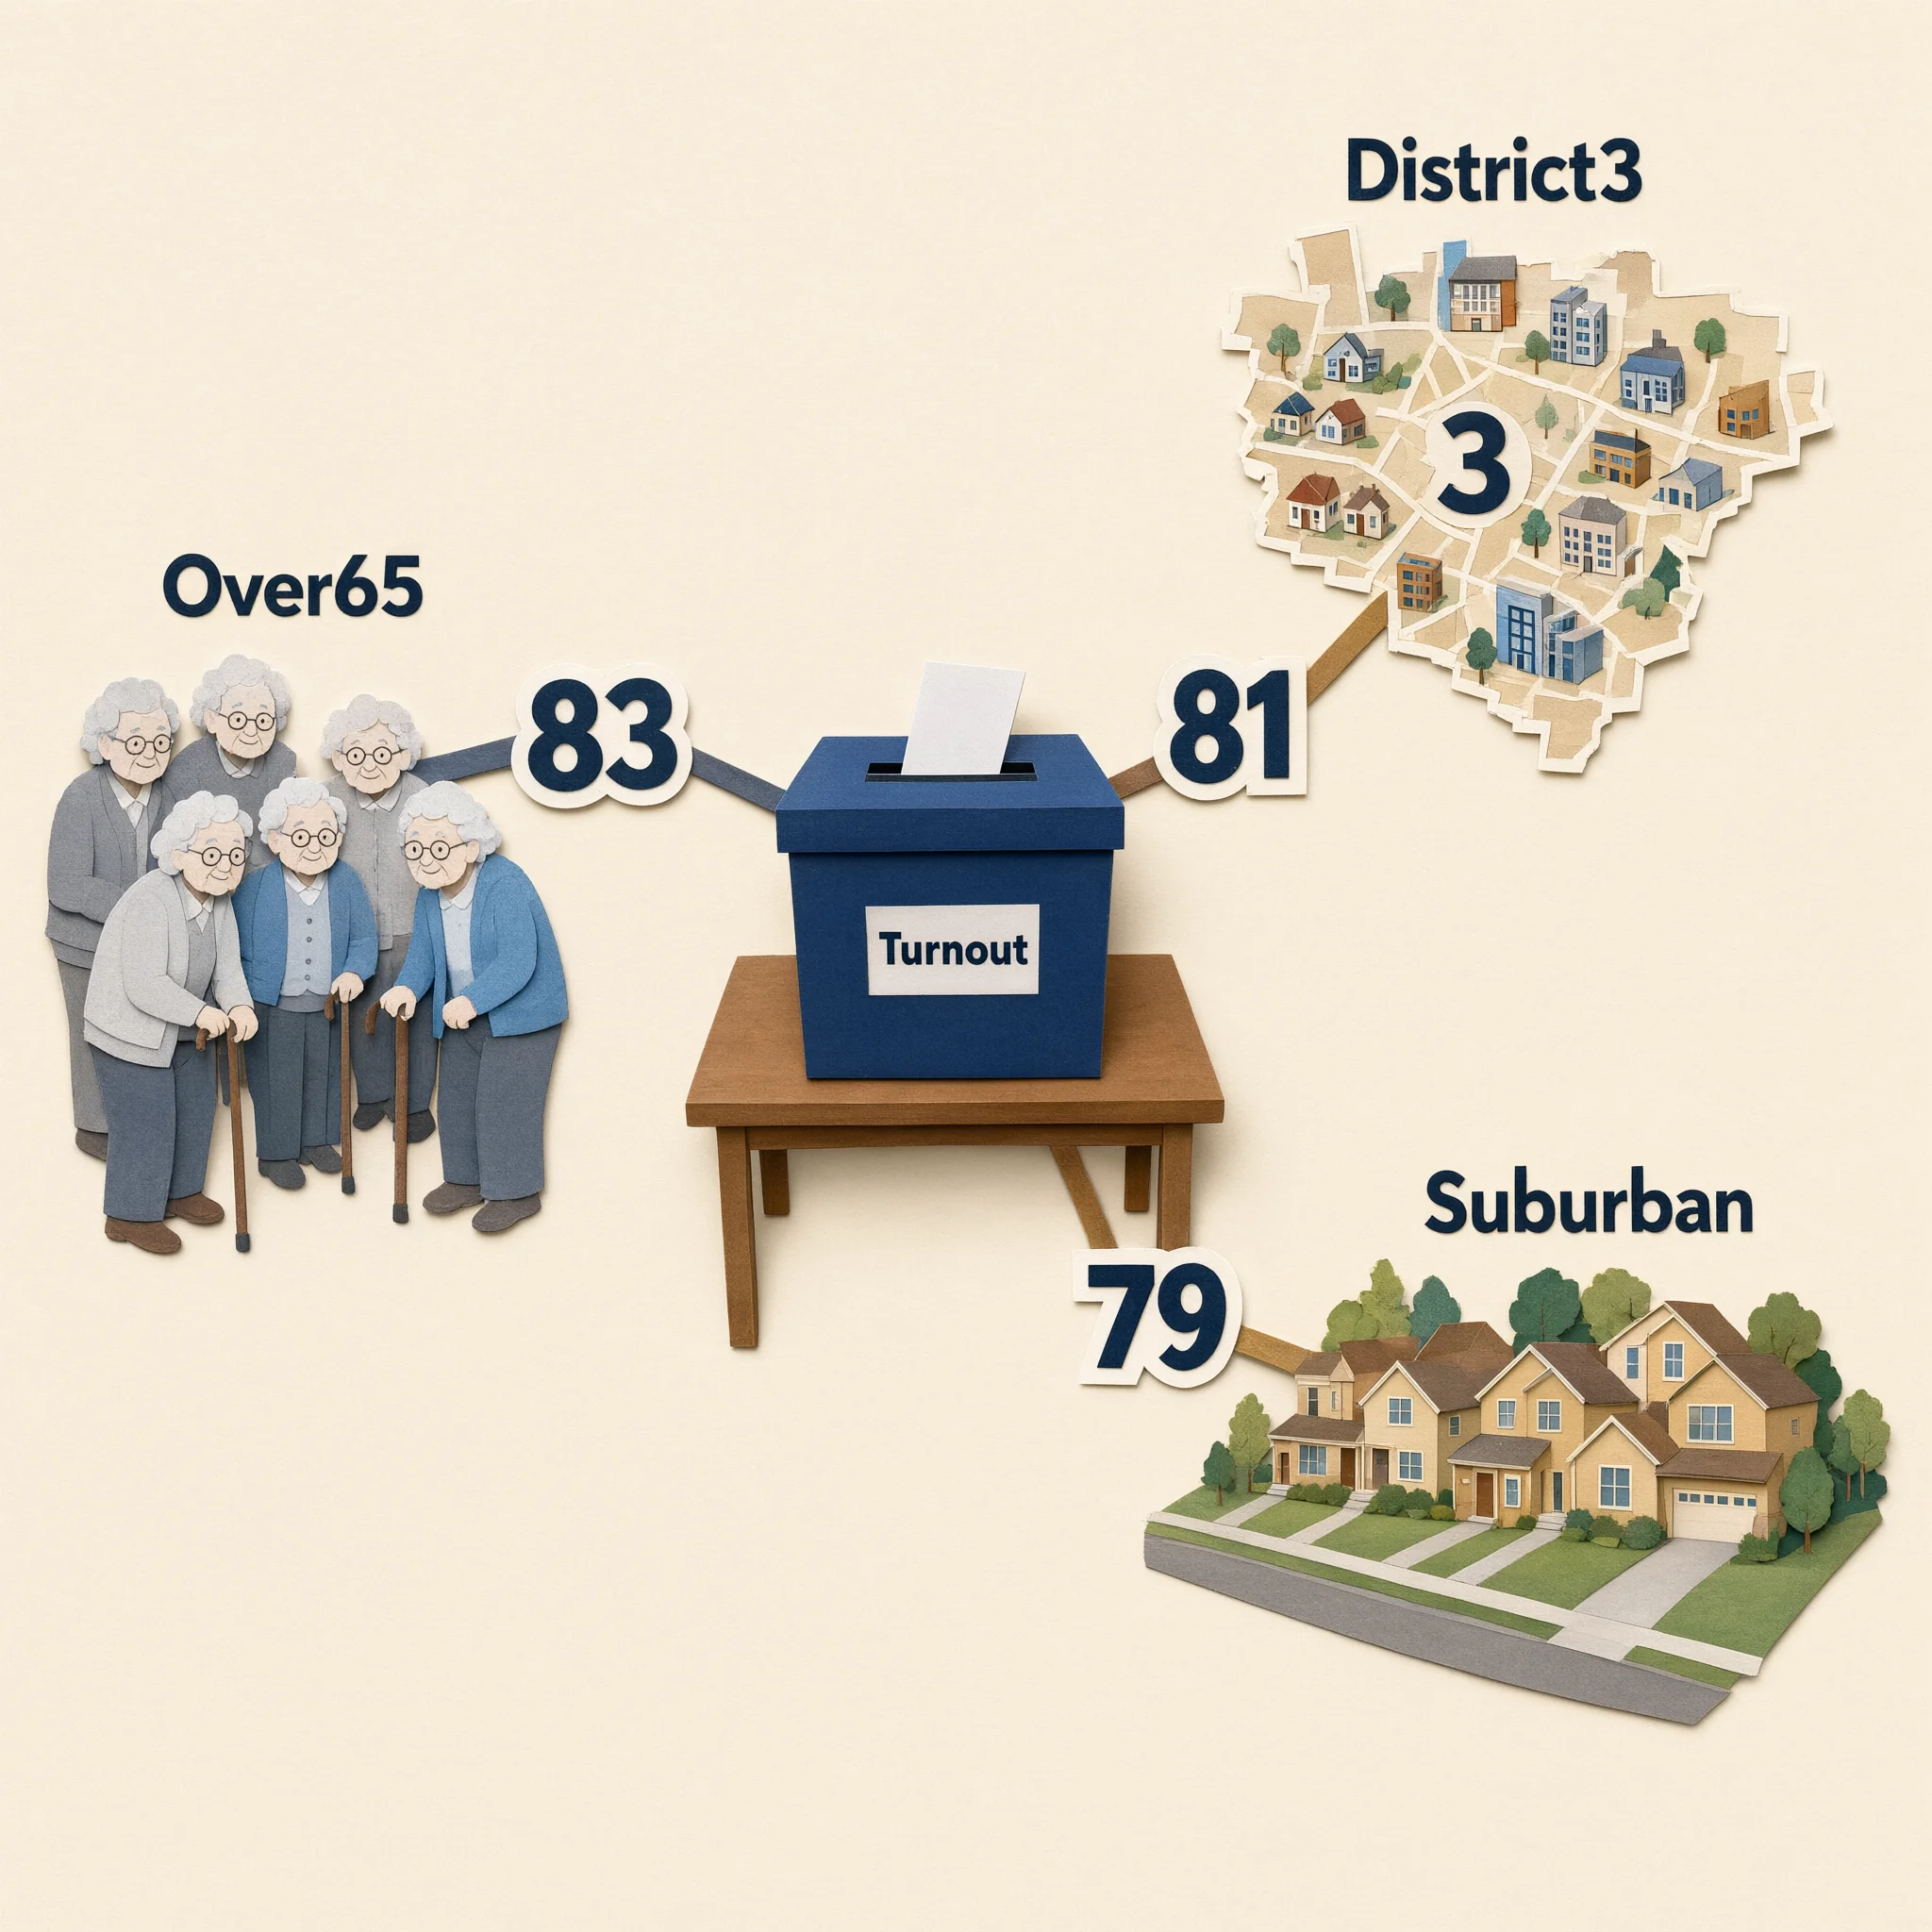
Consistent characters across slides build a narrative. Your readers learn to "read" the characters.
Slide Notes: Here we see the three highest-turnout groups: the elderly at 83%, District 3 at 81%, and suburban voters at 79%. These are our strongest segments, and we should focus our get-out-the-vote efforts on maintaining their engagement.
What This Means for Journalists and Newsrooms
For journalists, editors, and data teams, this tool is about telling better stories faster.
For Beat Reporters: You can now turn a dense government report into a shareable visual in minutes, not hours.
For Data Journalists: You can use this as a rapid prototyping tool to test which visual angles work best before investing time in custom graphics.
For Newsroom Leaders: You can empower your entire team to tell data-driven stories, regardless of their design or coding skills.
For Science and Health Journalists: You can make complex clinical or environmental data accessible to a general audience without losing accuracy.
Check out what the Variable Voices Community has built so far, and consider how this approach could change how you cover your next data-heavy story.
Your Turn
Think about the last press release, government report, or economic indicator you had to cover. Could a visual have helped you tell that story faster and more effectively?
Discussion