From Clinical Data to Compelling Stories: Visualizing Healthcare Outcomes Without the Jargon
We see it every day. A new study. A clinical trial summary. A quarterly report on patient outcomes for the hospital board. And with it comes the data-dense tables of p-values, confidence intervals, and demographic breakdowns.
If you work in healthcare, you know the feeling. Your eyes glaze over. You know the data is important. But the story? It's buried.
As someone who is deeply visual, I keep asking myself: why do we continue to present life-changing clinical data in ways that are so hard to comprehend? The answer is simple: turning columns of numbers into something meaningful is genuinely difficult.
But what if we could transpose those numbers-and their column headers-into a picture? A picture is worth a thousand words. And in healthcare, those words could save lives.
The Challenge: Communicating Complex Data to Diverse Audiences
The healthcare industry faces a unique data communication problem. You're not just presenting to researchers. You're presenting to hospital administrators, board members, patients, grant committees, and sometimes the general public. Each audience has a different level of data literacy.
-
Researchers want the p-values and confidence intervals.
-
Administrators want the big-picture impact on costs and outcomes.
-
Patients want to understand their own health story.
-
Funders want to see tangible proof of impact.
One spreadsheet cannot serve all these needs. But a visual story? That can be adapted.
The Solution: Turning Healthcare Data into Visual Narratives
I built a tool specifically to address this challenge. Here's how it works:
-
Upload any CSV of healthcare data-patient outcomes, readmission rates, clinical trial results, you name it. Even just two columns is enough.
-
Hit Explore, and the AI generates multiple data "flows," pivoting your data into optional datasets you can choose from.
-
Pick a dataset, select a visual style, and click Visualize.
Here's the magic: The AI analyzes the variables in your data and creates a unique character for each one-think of them as mini prompts that give personality to your numbers. It weaves those characters into a prompt that generates a full Slide Deck based on your dataset.
The result? A set of text-to-image prompts, each with locked-in characters for consistency across slides. Drop those prompts into your favorite paid AI image generator, and watch your healthcare data come to life.
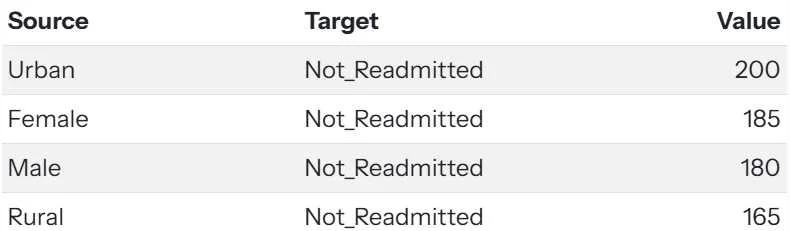
Before: The Traditional View. This is the data. Important, but visually impenetrable for non-researchers.
After: The Visual Story. Instantly understandable, even for a board member or patient advocate.
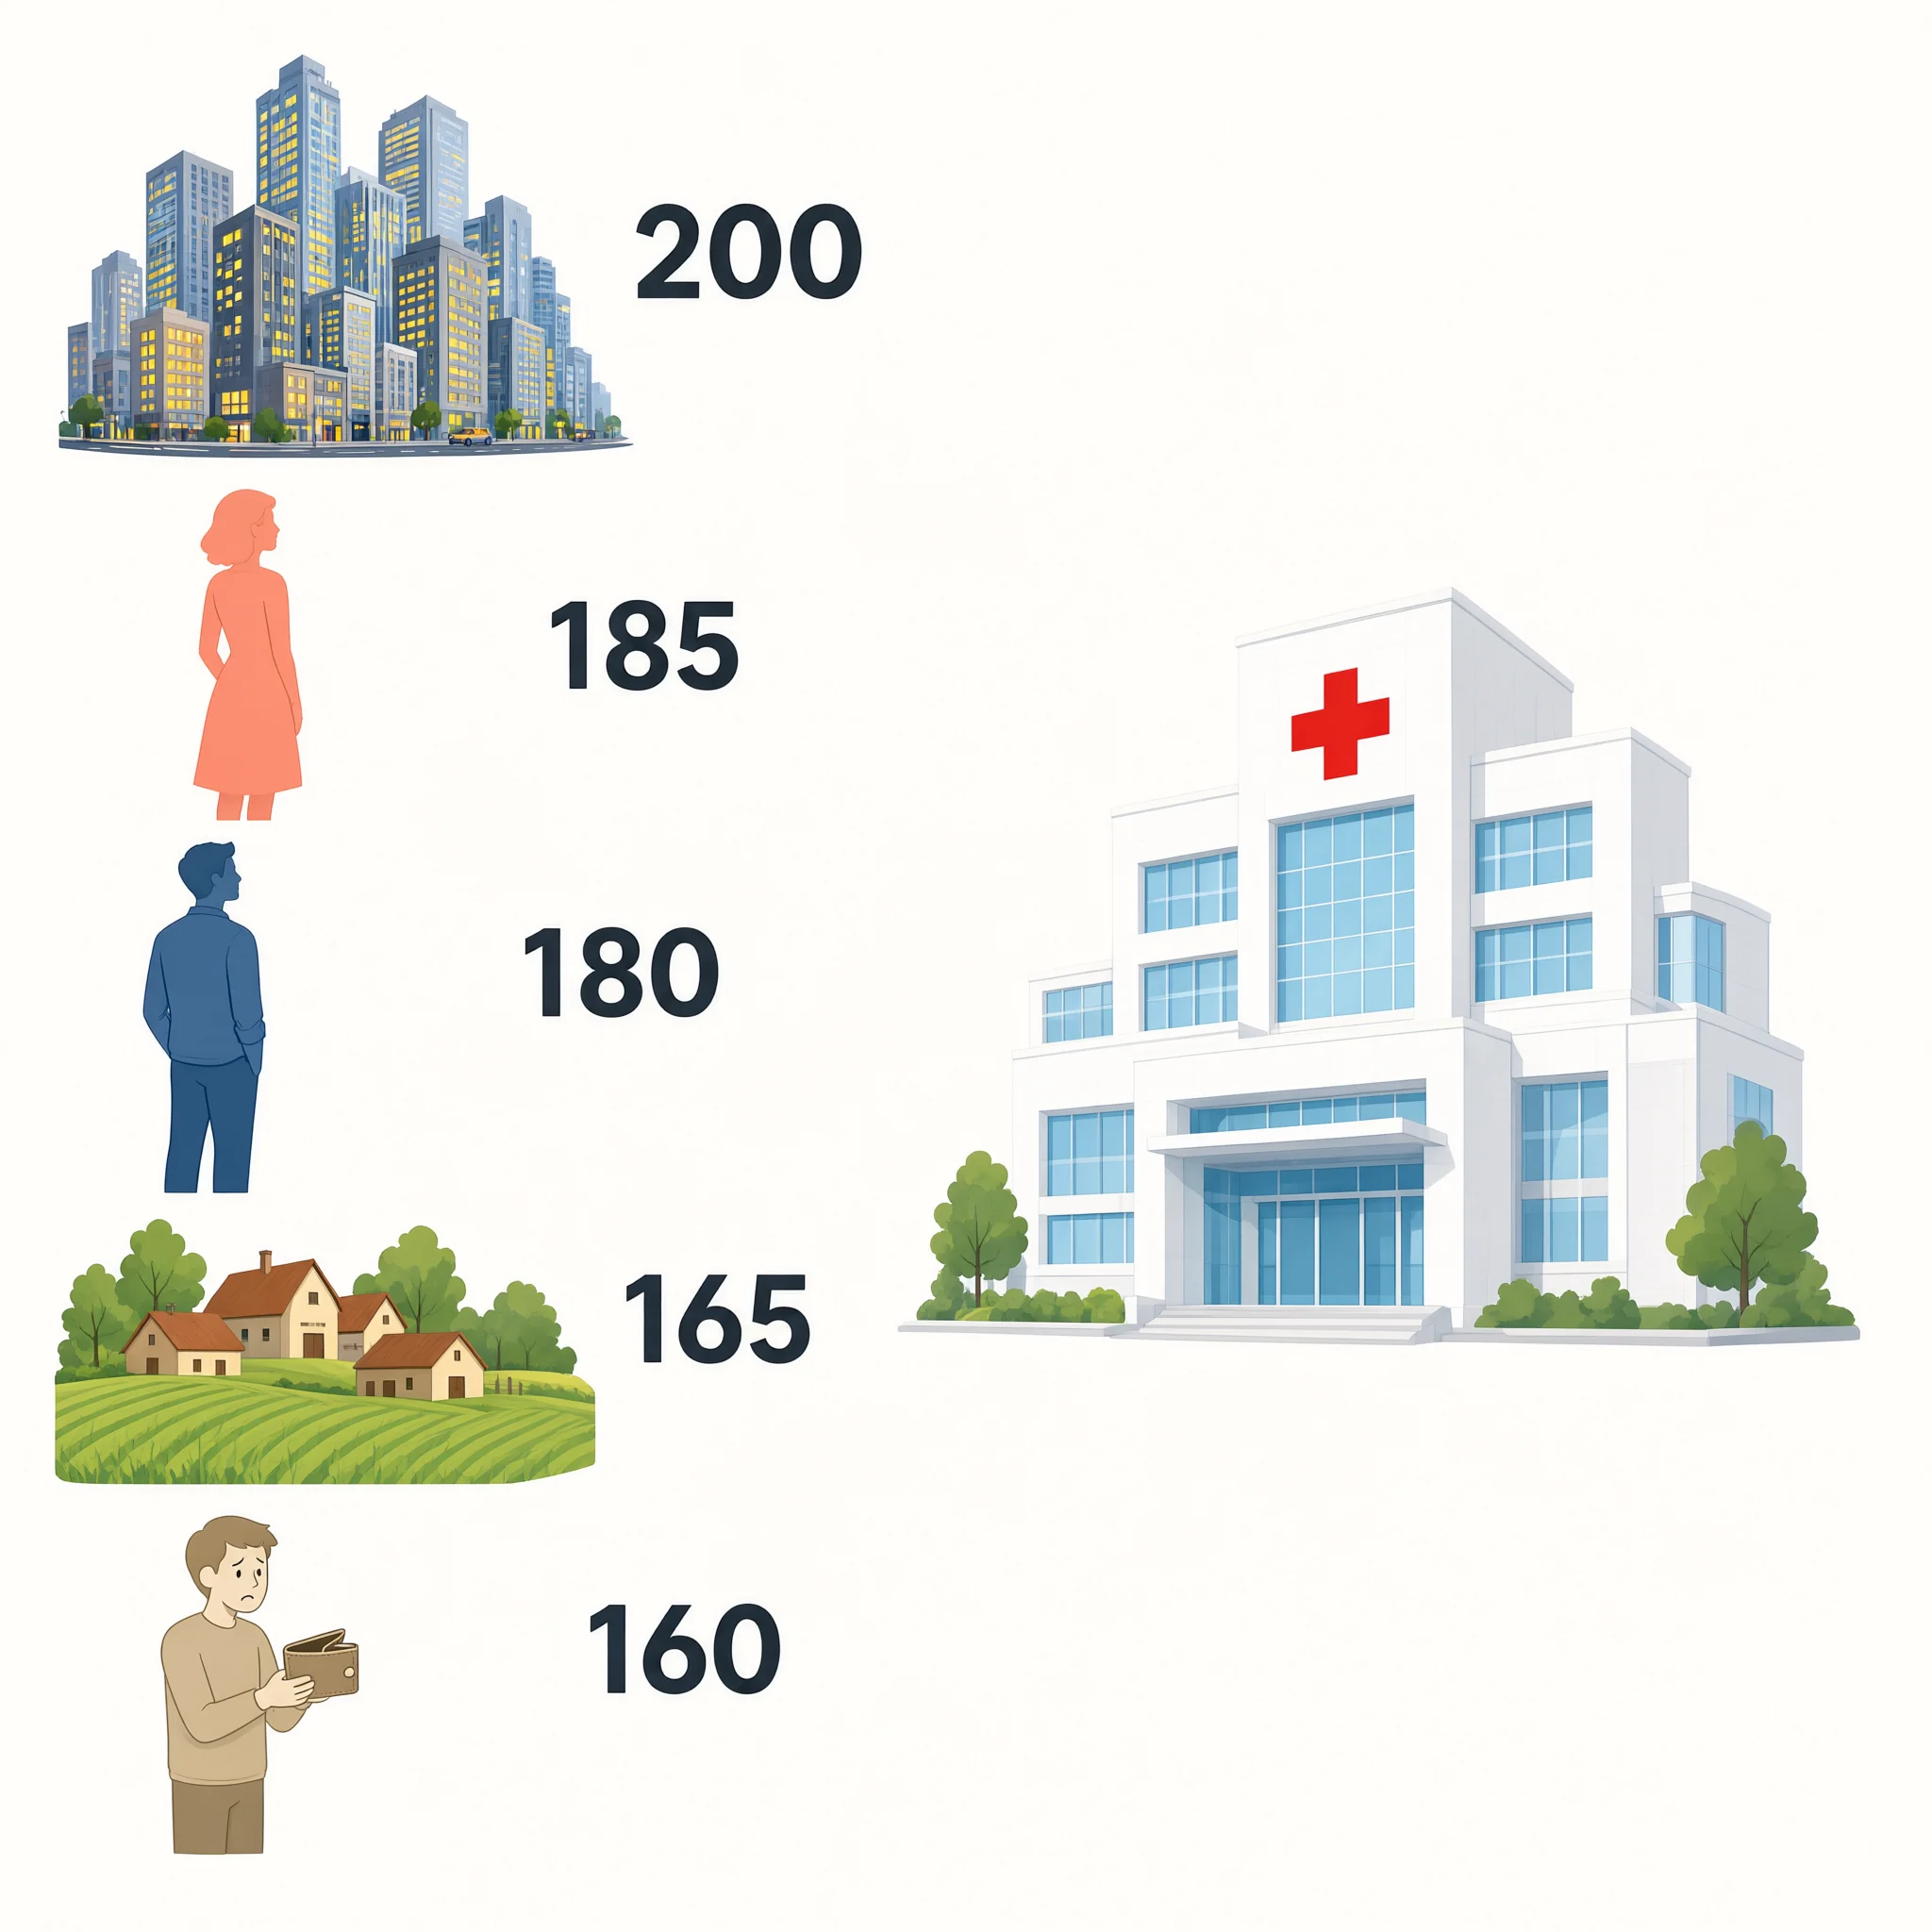
Above is the Overview slide.
It includes Slide Notes so you know what to say: This overview shows all the factors that contribute to patients not being readmitted. Urban areas have the highest count at 200, followed by female patients at 185 and male patients at 180. Rural areas and underinsured patients contribute 165 and 160 respectively.
Which one is more intuitive-the chart or the image? Let us know in the comments.
The Power of Consistency: Character-Driven Storytelling
Notice how the AI creates consistent characters for each data variable. This is crucial for healthcare communication. Consistent characters across slides build a narrative. Your audience learns to "read" the characters.
Slide 2 and its speaking notes: This slide highlights two major sources: urban populations and underinsured individuals. Urban areas show the highest number of non-readmissions at 200, while underinsured patients contribute 160, a significant but lower figure. 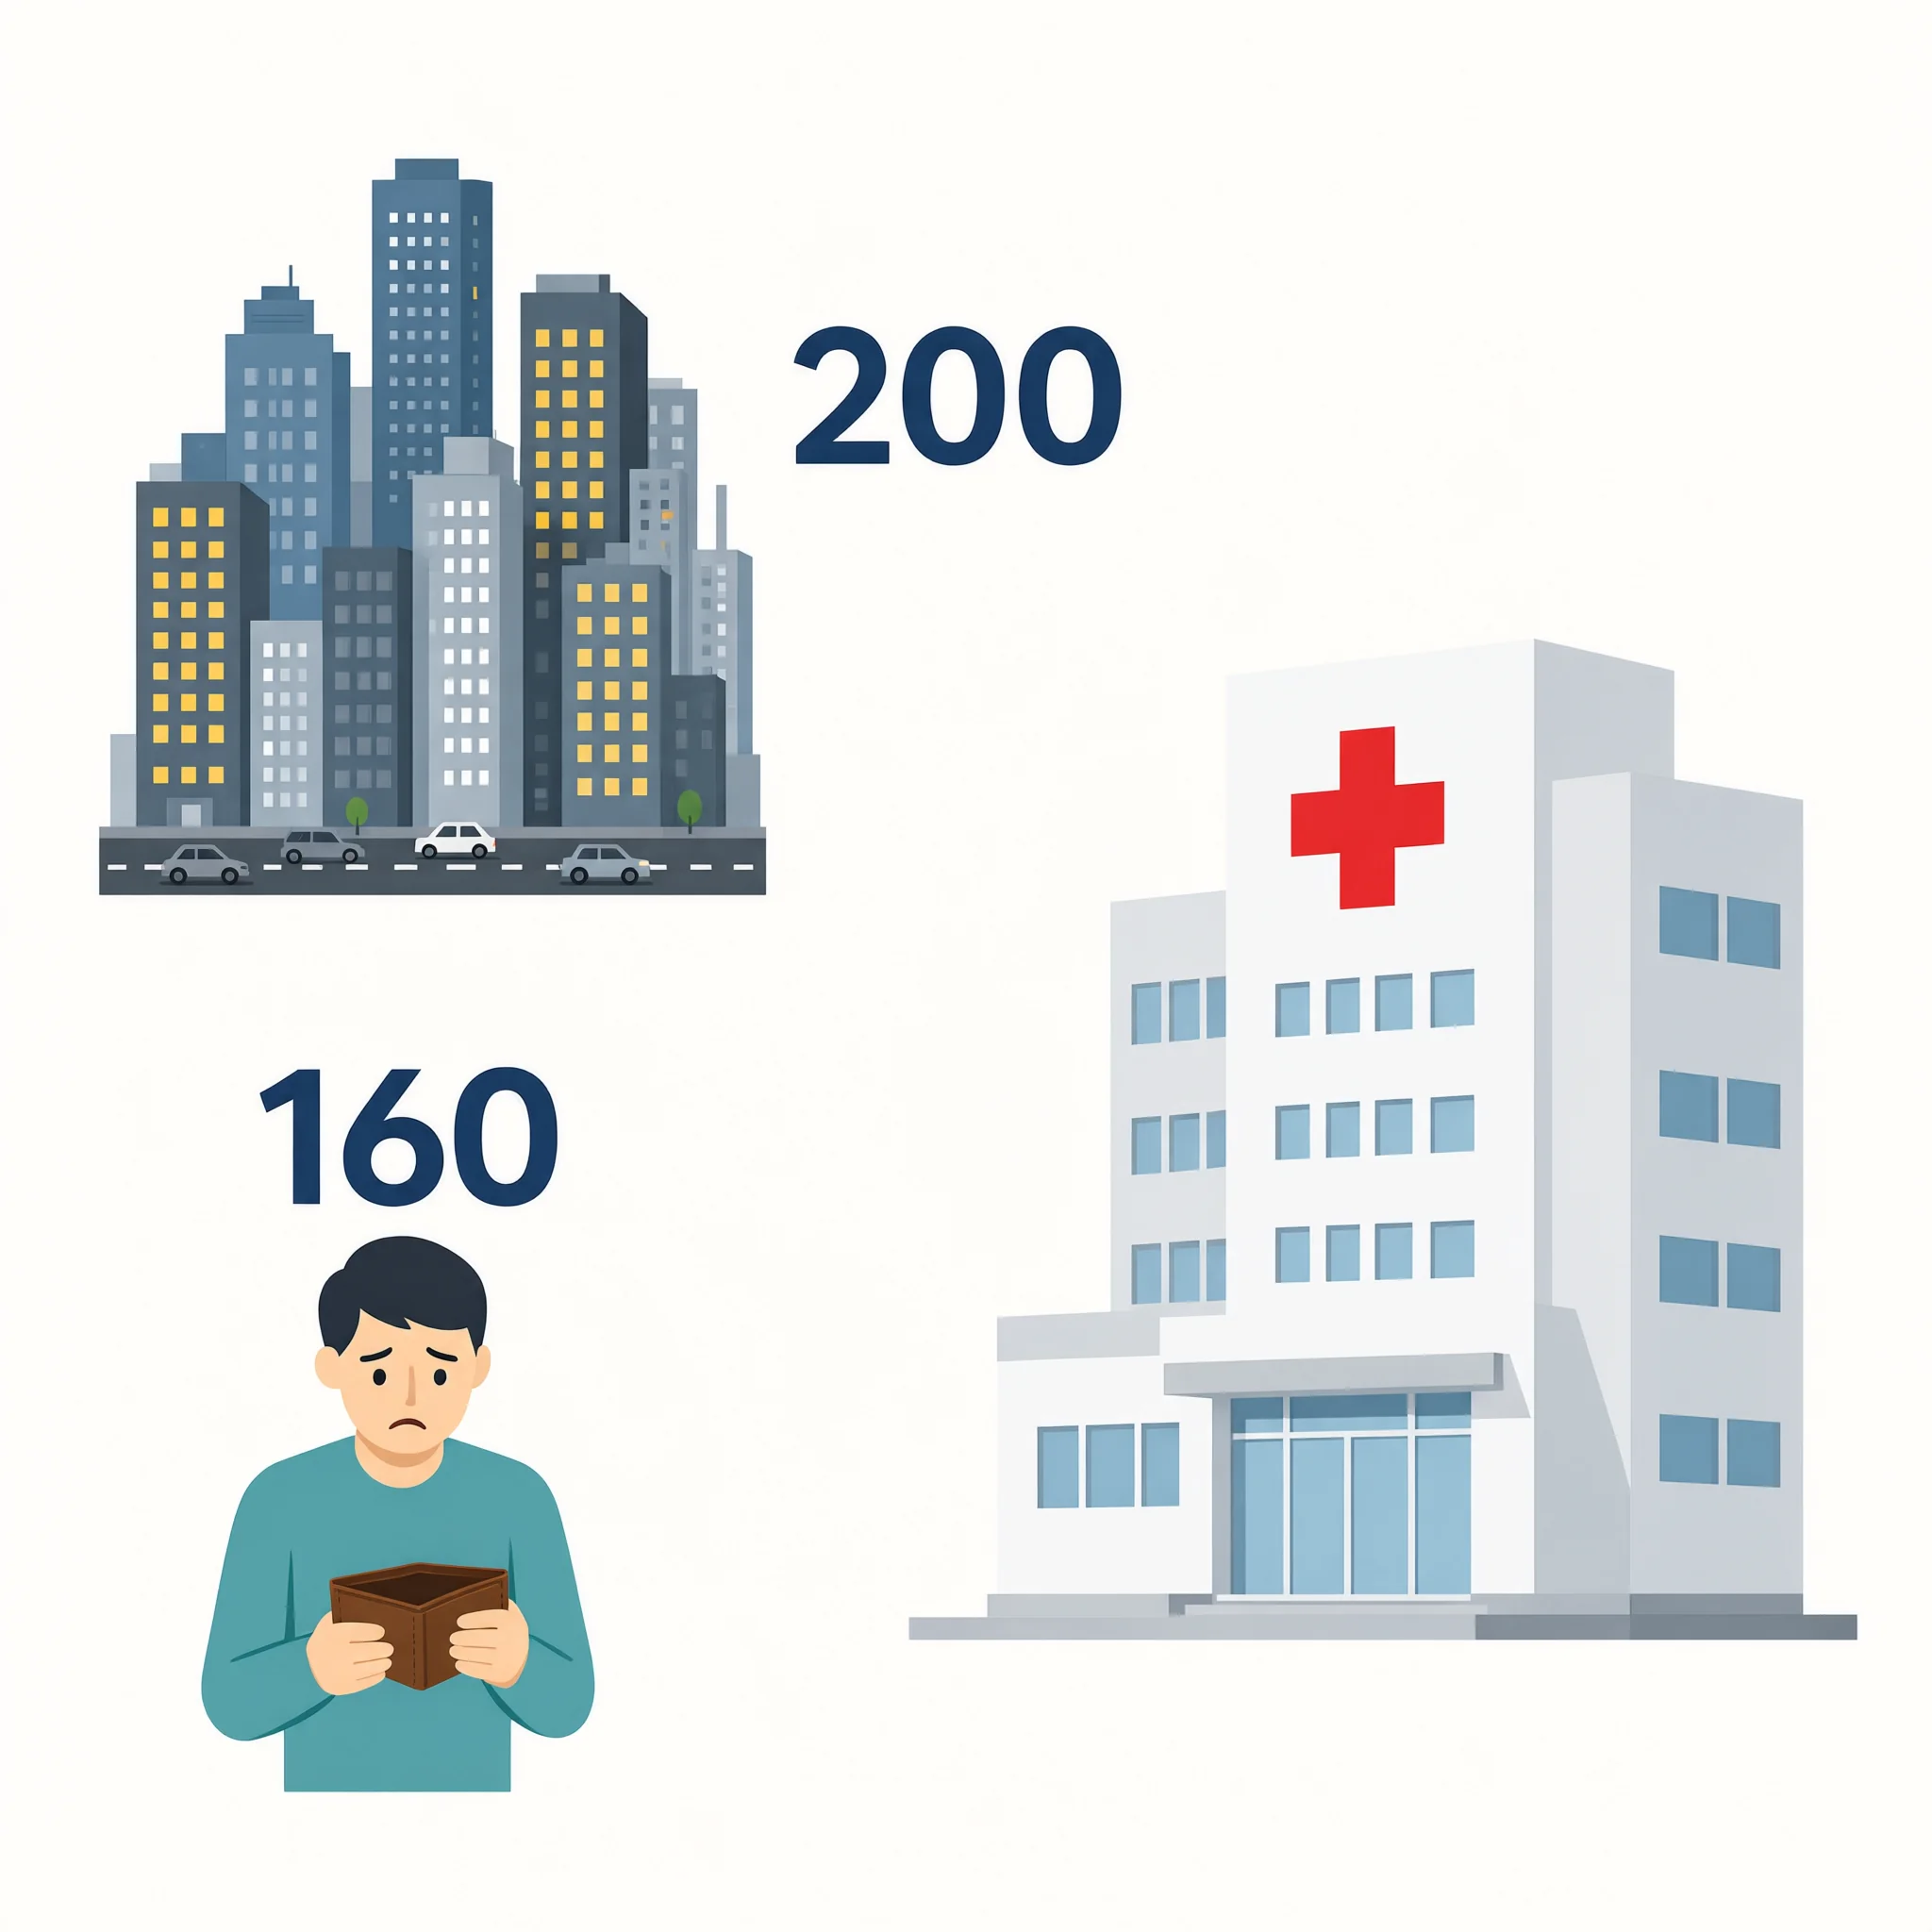
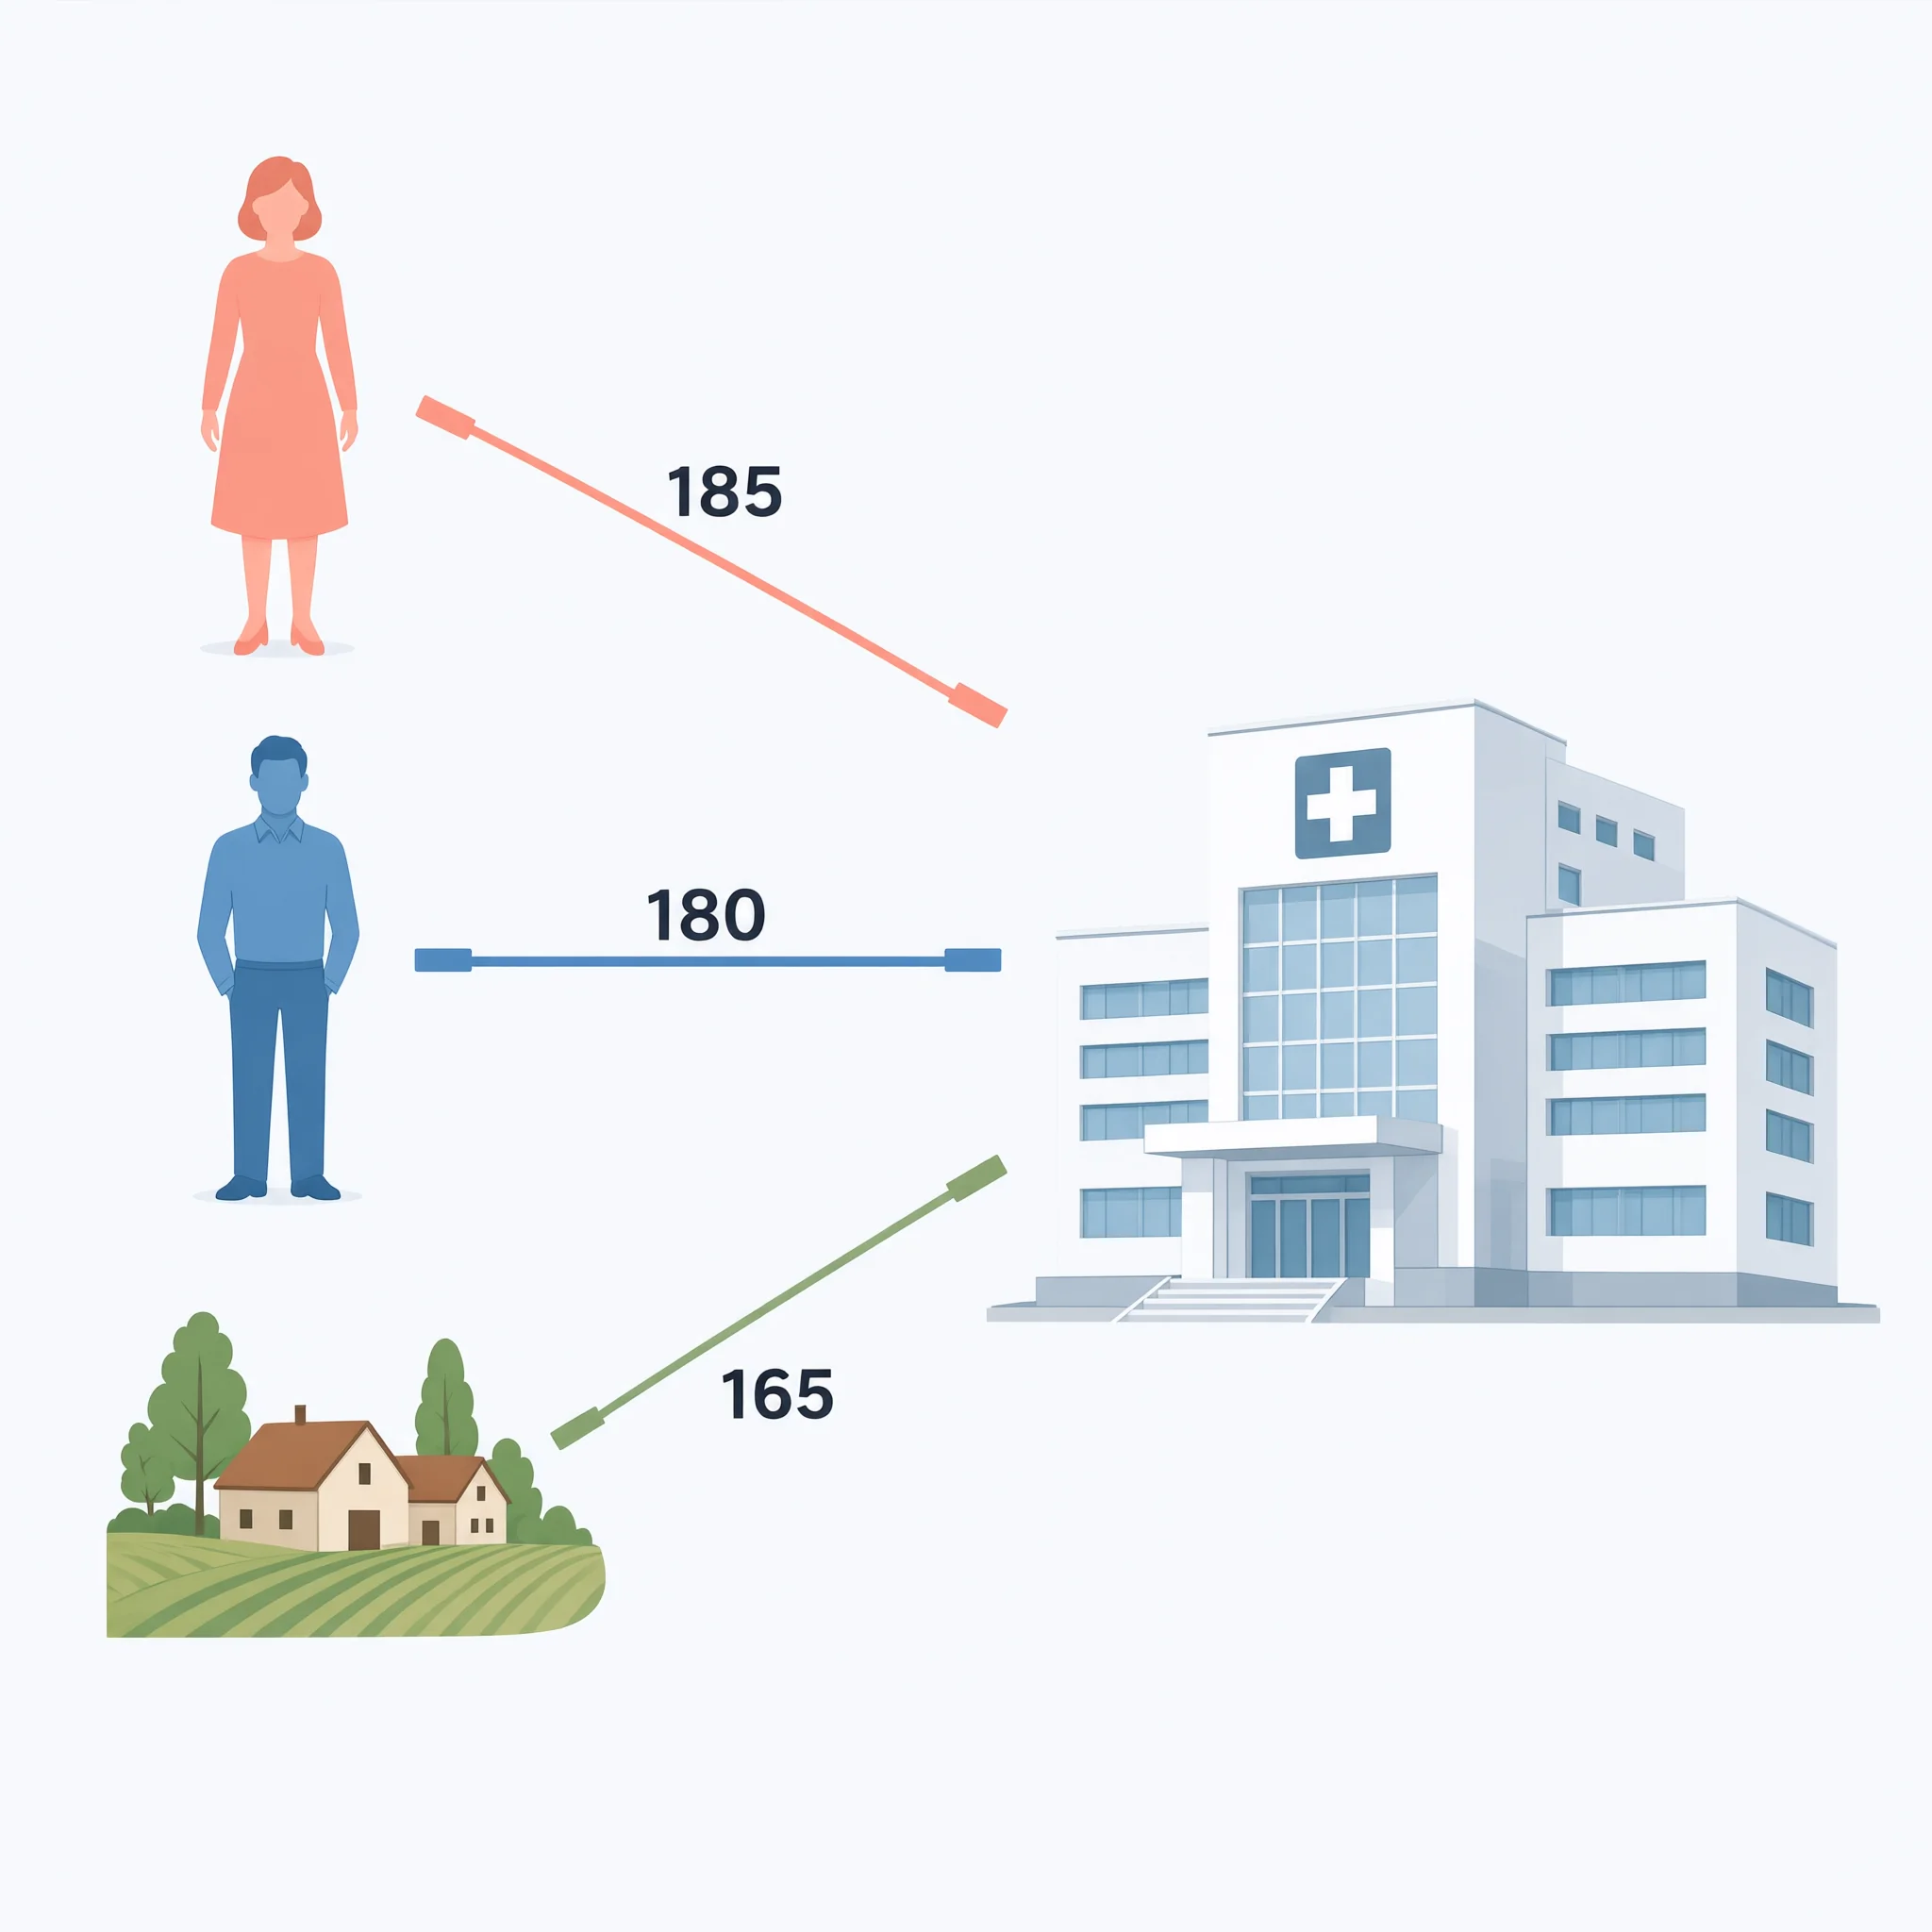
Slide 3 and its speaking notes: This slide breaks down non-readmission counts by gender and geography. Female patients lead with 185, closely followed by male patients at 180. Rural areas trail slightly with 165, showing a more balanced distribution across these groups.
What This Means for Healthcare Professionals
For clinicians, researchers, and administrators, this tool is not about dumbing down data. It's about amplifying understanding.
For Health Journalists and Communicators: You can now turn press releases about breakthrough studies into shareable visuals in minutes.
For Clinical Researchers: You can present your findings to non-specialist audiences without losing nuance.
For Hospital Administrators: You can show your board the impact of a new policy in a way that drives decisions, not confusion.
For the American Medical Informatics Association (AMIA) Community: For those of us in informatics, we know that information is only valuable when it's understood. This tool is designed with that principle at its core-bridging the gap between complex healthcare data and human comprehension.
Check out what the Variable Voices Community has built so far, and consider how this approach could change how you present your next set of findings.
Your Turn
Think about the last clinical report, grant proposal, or study summary you had to digest. Could a visual have helped?
Discussion