From Data Glaze to Data Gaze: Turning Spreadsheets into Stories
We see it every day - posts, press releases, news articles, all armed with data. But be honest: when you hit a chart packed with obscure numbers and cryptic axis labels, do your eyes just… glaze over?
As a highly visual person, I keep asking myself: why do so many data-heavy articles still rely on cold, hard-to-digest tables? The answer, of course, is that it’s genuinely hard to turn column names and digits into something meaningful.
But what if we flipped the script? What if we could transpose those numbers—and their column headers - into a picture? After all, a picture is said to be worth a thousand words.
Now, you might be thinking: “Can’t I just ask AI to turn a table into an image?” Sure, but the real question is how—how do you get from raw CSV to a compelling visual narrative, without losing control of the story?
That’s exactly why I built this tool.
Here’s how it works:
-
Upload any CSV- even if it’s just two columns without values.
-
Hit Explore, and the AI generates multiple data “flows,” pivoting your data into optional datasets you can choose from.
-
Here’s the magic: pick a dataset, select a visual style, and then click Visualize.
The AI then analyzes the variables in your data and creates a unique character for each one - think of them as mini prompts that give personality to your numbers. It weaves those characters into a prompt that generates a full Slide Deck based on your dataset.
The result? A set of text-to-image prompts, each with locked-in characters for consistency across slides. Drop those prompts into your favorite paid AI image generator, and watch your data come to life.
So, let’s circle back to that press release or news article. Instead of squinting at a chart, you now have a picture… a 1,000-foot view of what your data is actually saying.
Before:
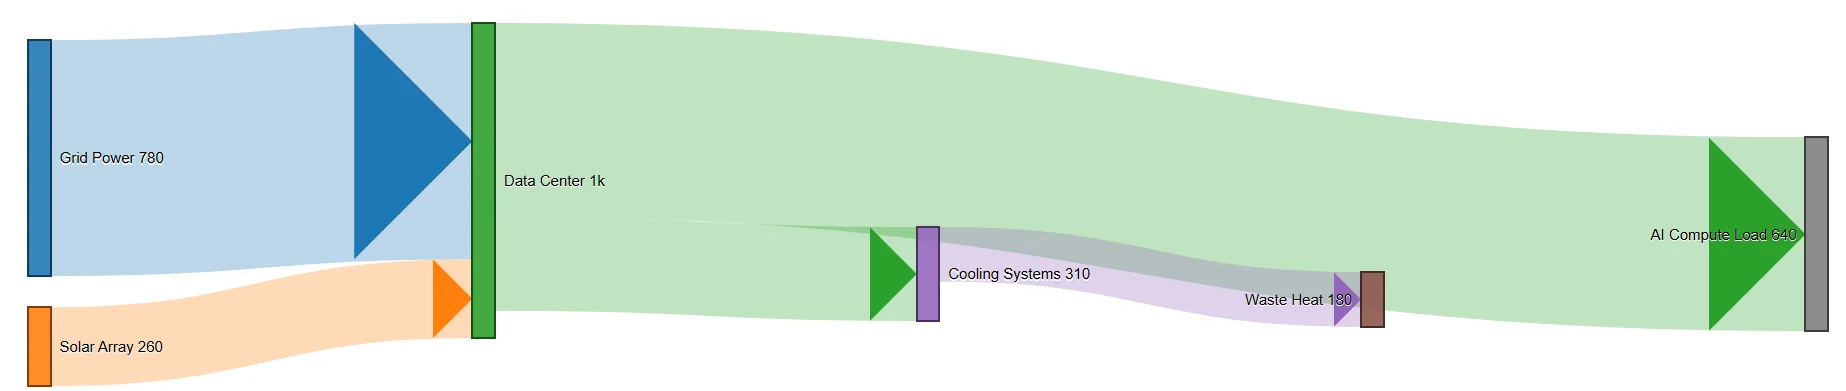
After:

Which one feels more intuitive to you - the chart or the image? Drop your thoughts in the comments - I’d genuinely love to know.
And here’s the kicker: each flow also generates its own dedicated text-to-image prompt, with those character mini-prompts locked in, so your data representation stays consistent across slides.
The first slide based on the data:

Notice how the “data center” character appears consistently across both slides/images? That’s the power of locked-in storytelling.
Curious to see what others have built? Check out the Variable Voices Community and explore the creations so far.
Let’s turn data into dialogue—one image at a time.
Discussion