Give every variable in your data a voice.
Upload a CSV, let AI propose a few different ways to slice it into flows, then turn whatever you land on into ready-to-paste AI-image-generation prompts - one per slide, each entity locked to a consistent look throughout. Don't have data yet? Browse what others have made.
5 free credits to start · no card required
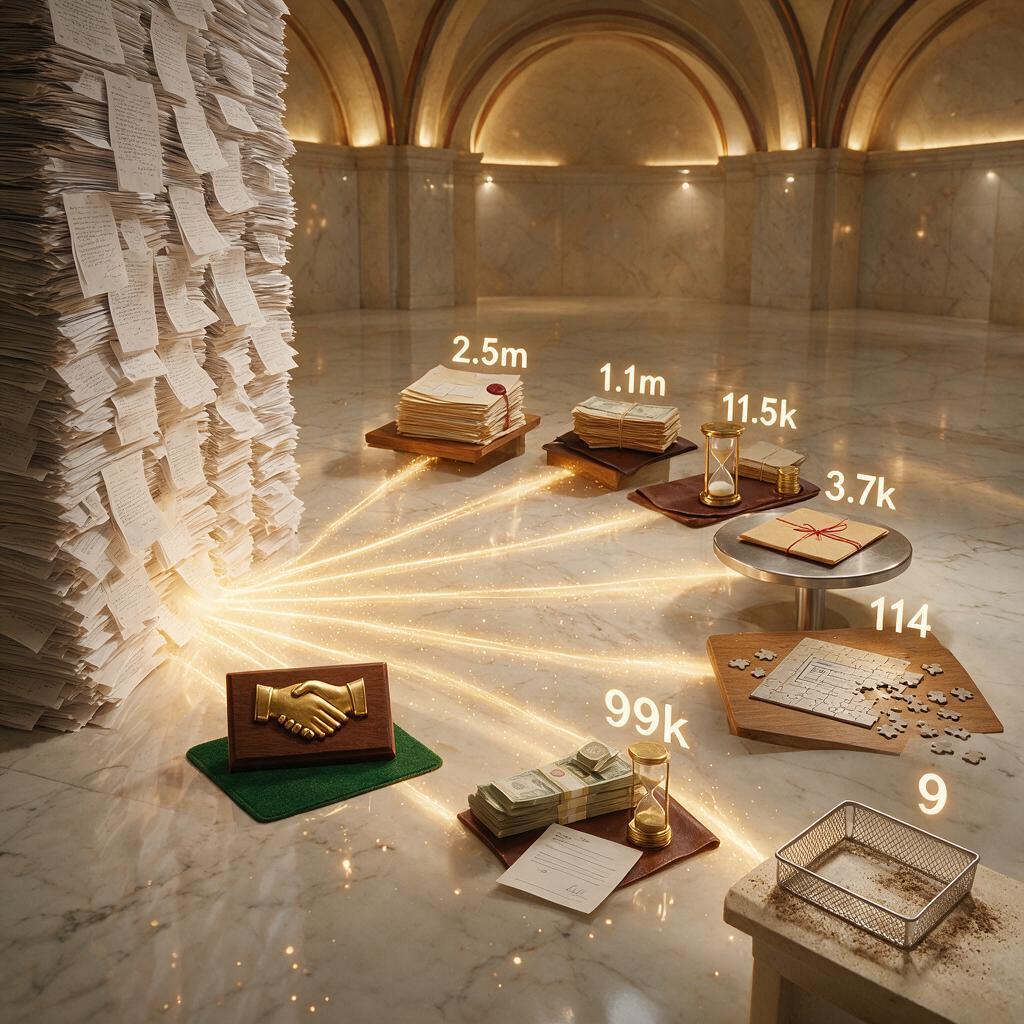
This overview shows the entire complaint resolution pipeline at a glance: a single massive intake of complaints on the left, branching into seven possible outcomes on the right. The largest flows are 'Closed with explanation' at 2.5 million and 'Closed with non-monetary relief' at 1.1 million, followed by 'Closed with monetary relief' at 99 thousand. The smaller tail includes 'Untimely response' at 11.5 thousand, 'Closed' at 3.7 thousand, 'In progress' at 114, and 'No Response Recorded' at just 9. We'll now walk through the detailed slides to see how these outcomes break down.
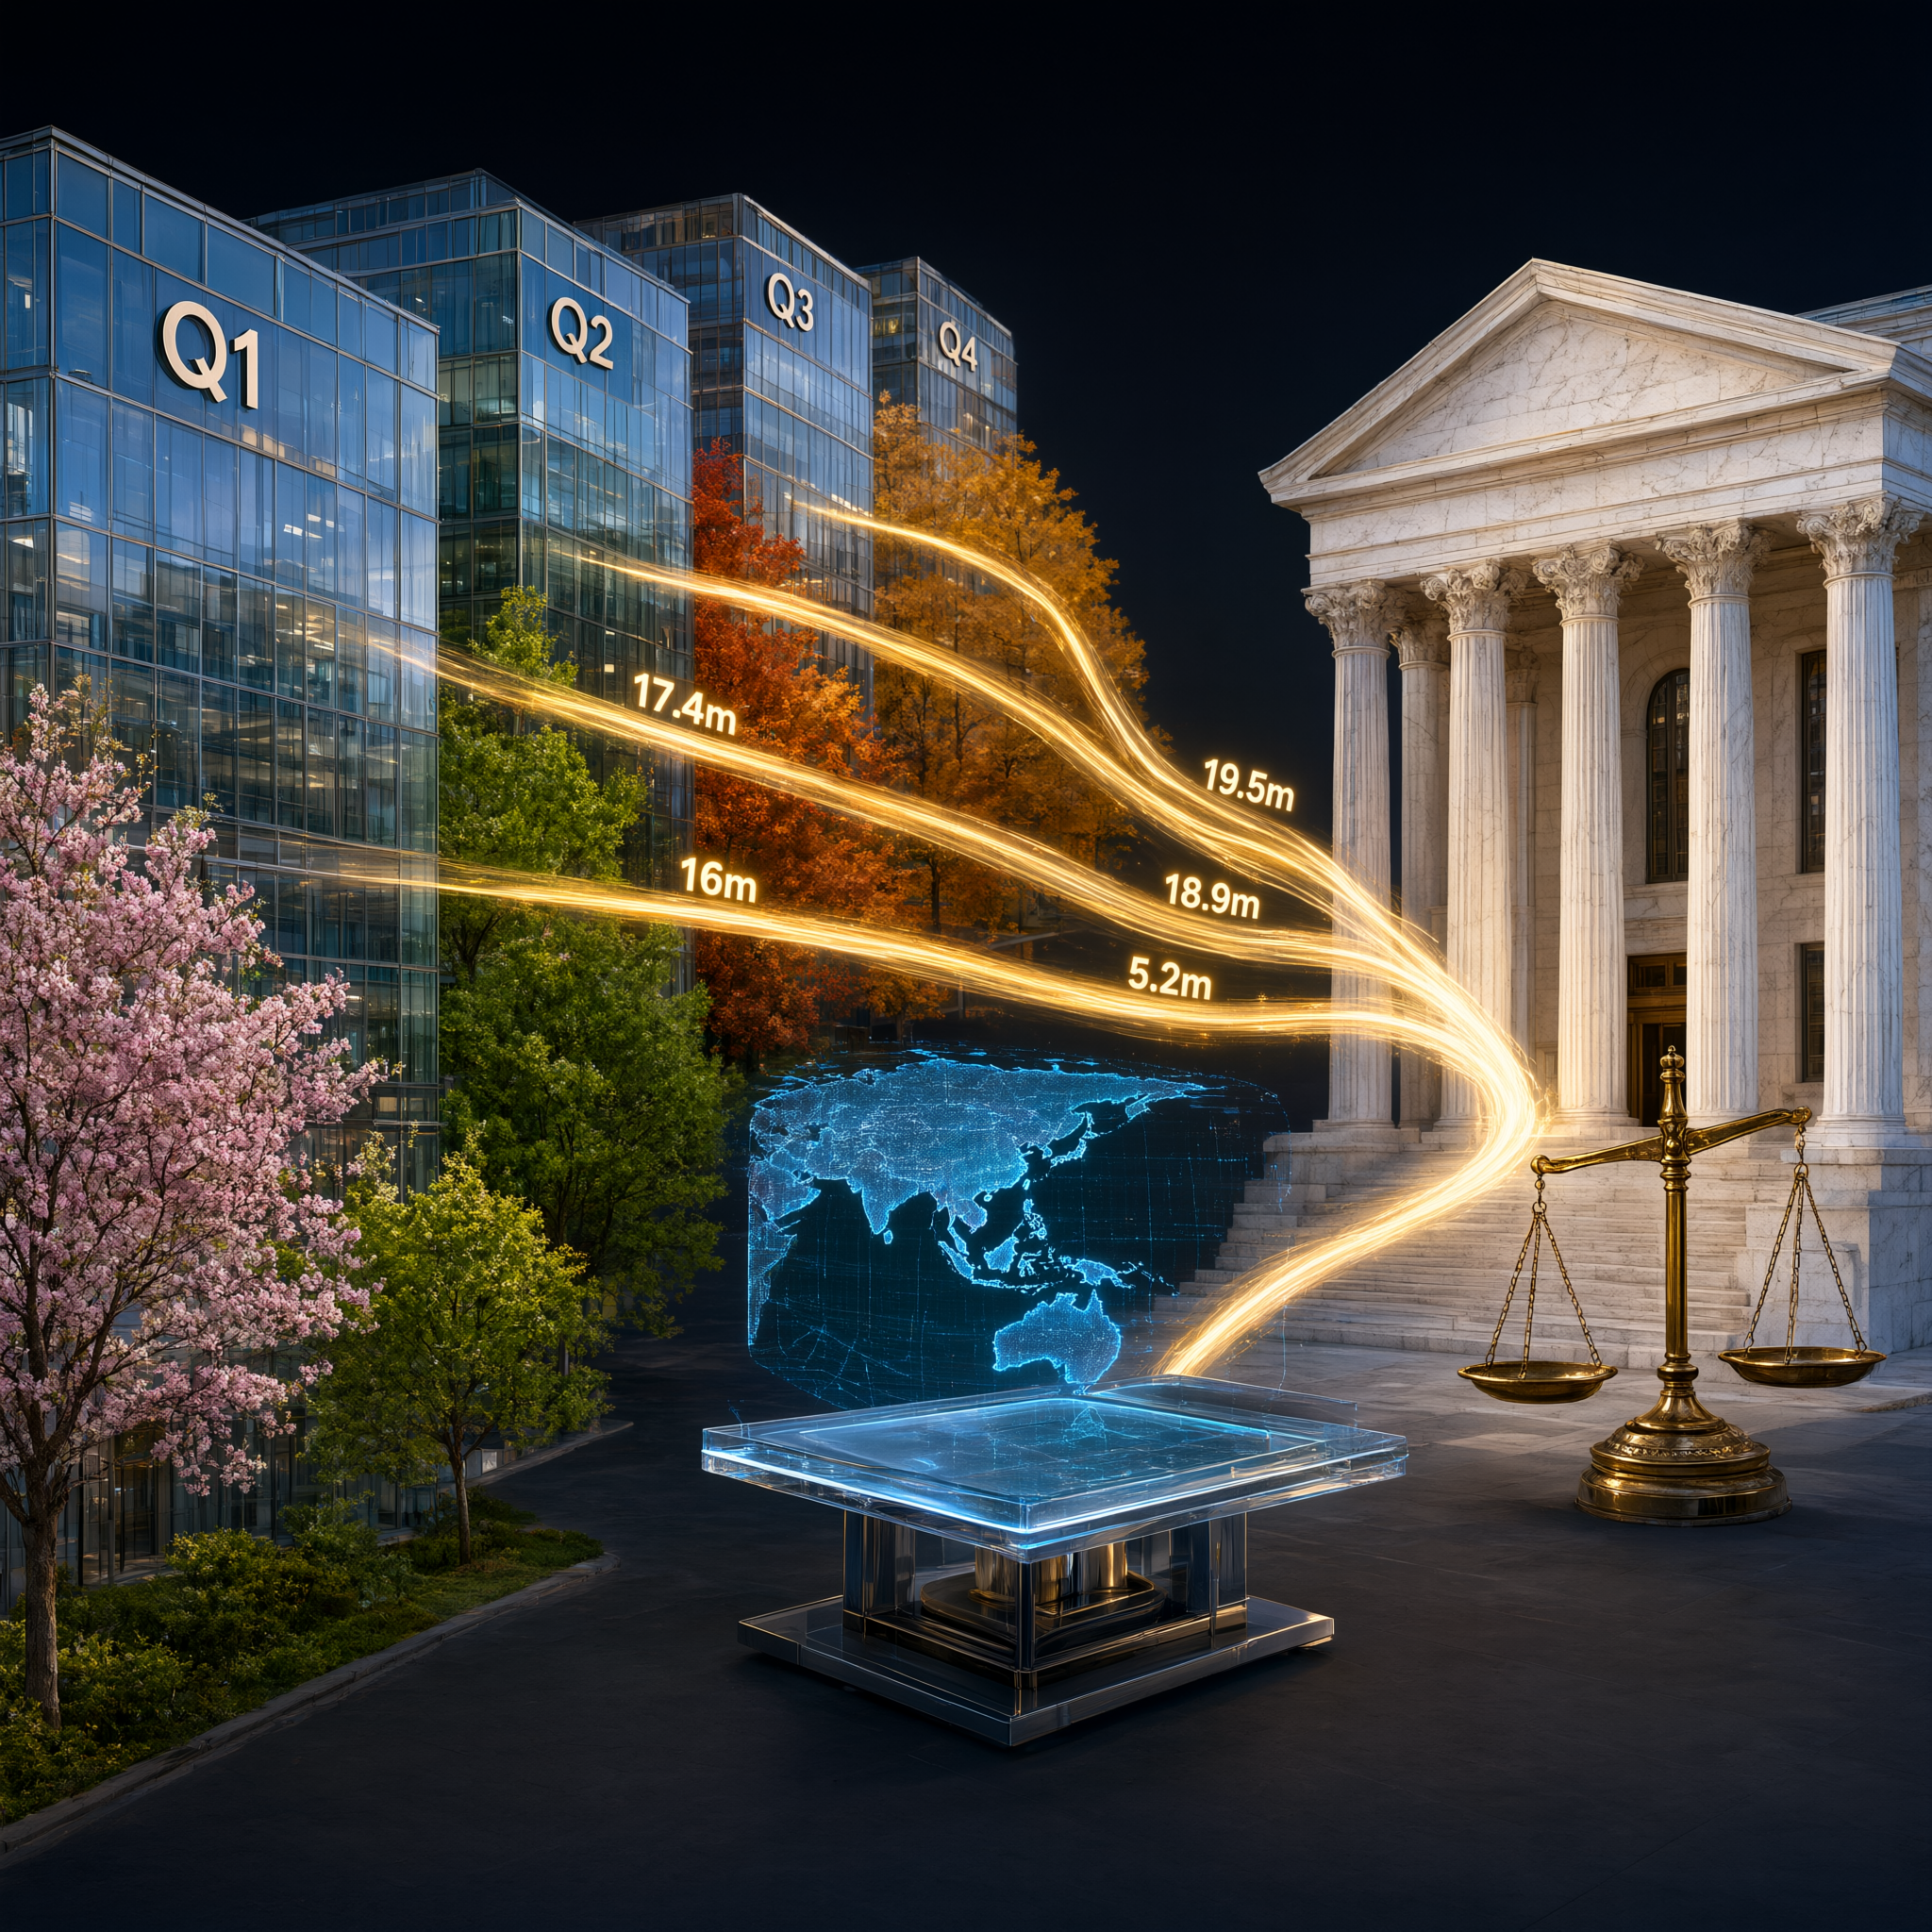
This overview shows our revenue streams for the year. Each quarter contributes progressively, from Q1 at 16 million to Q4 at 19.5 million, and Asia Pacific adds 5.2 million on top. The next slides break these flows down in detail.
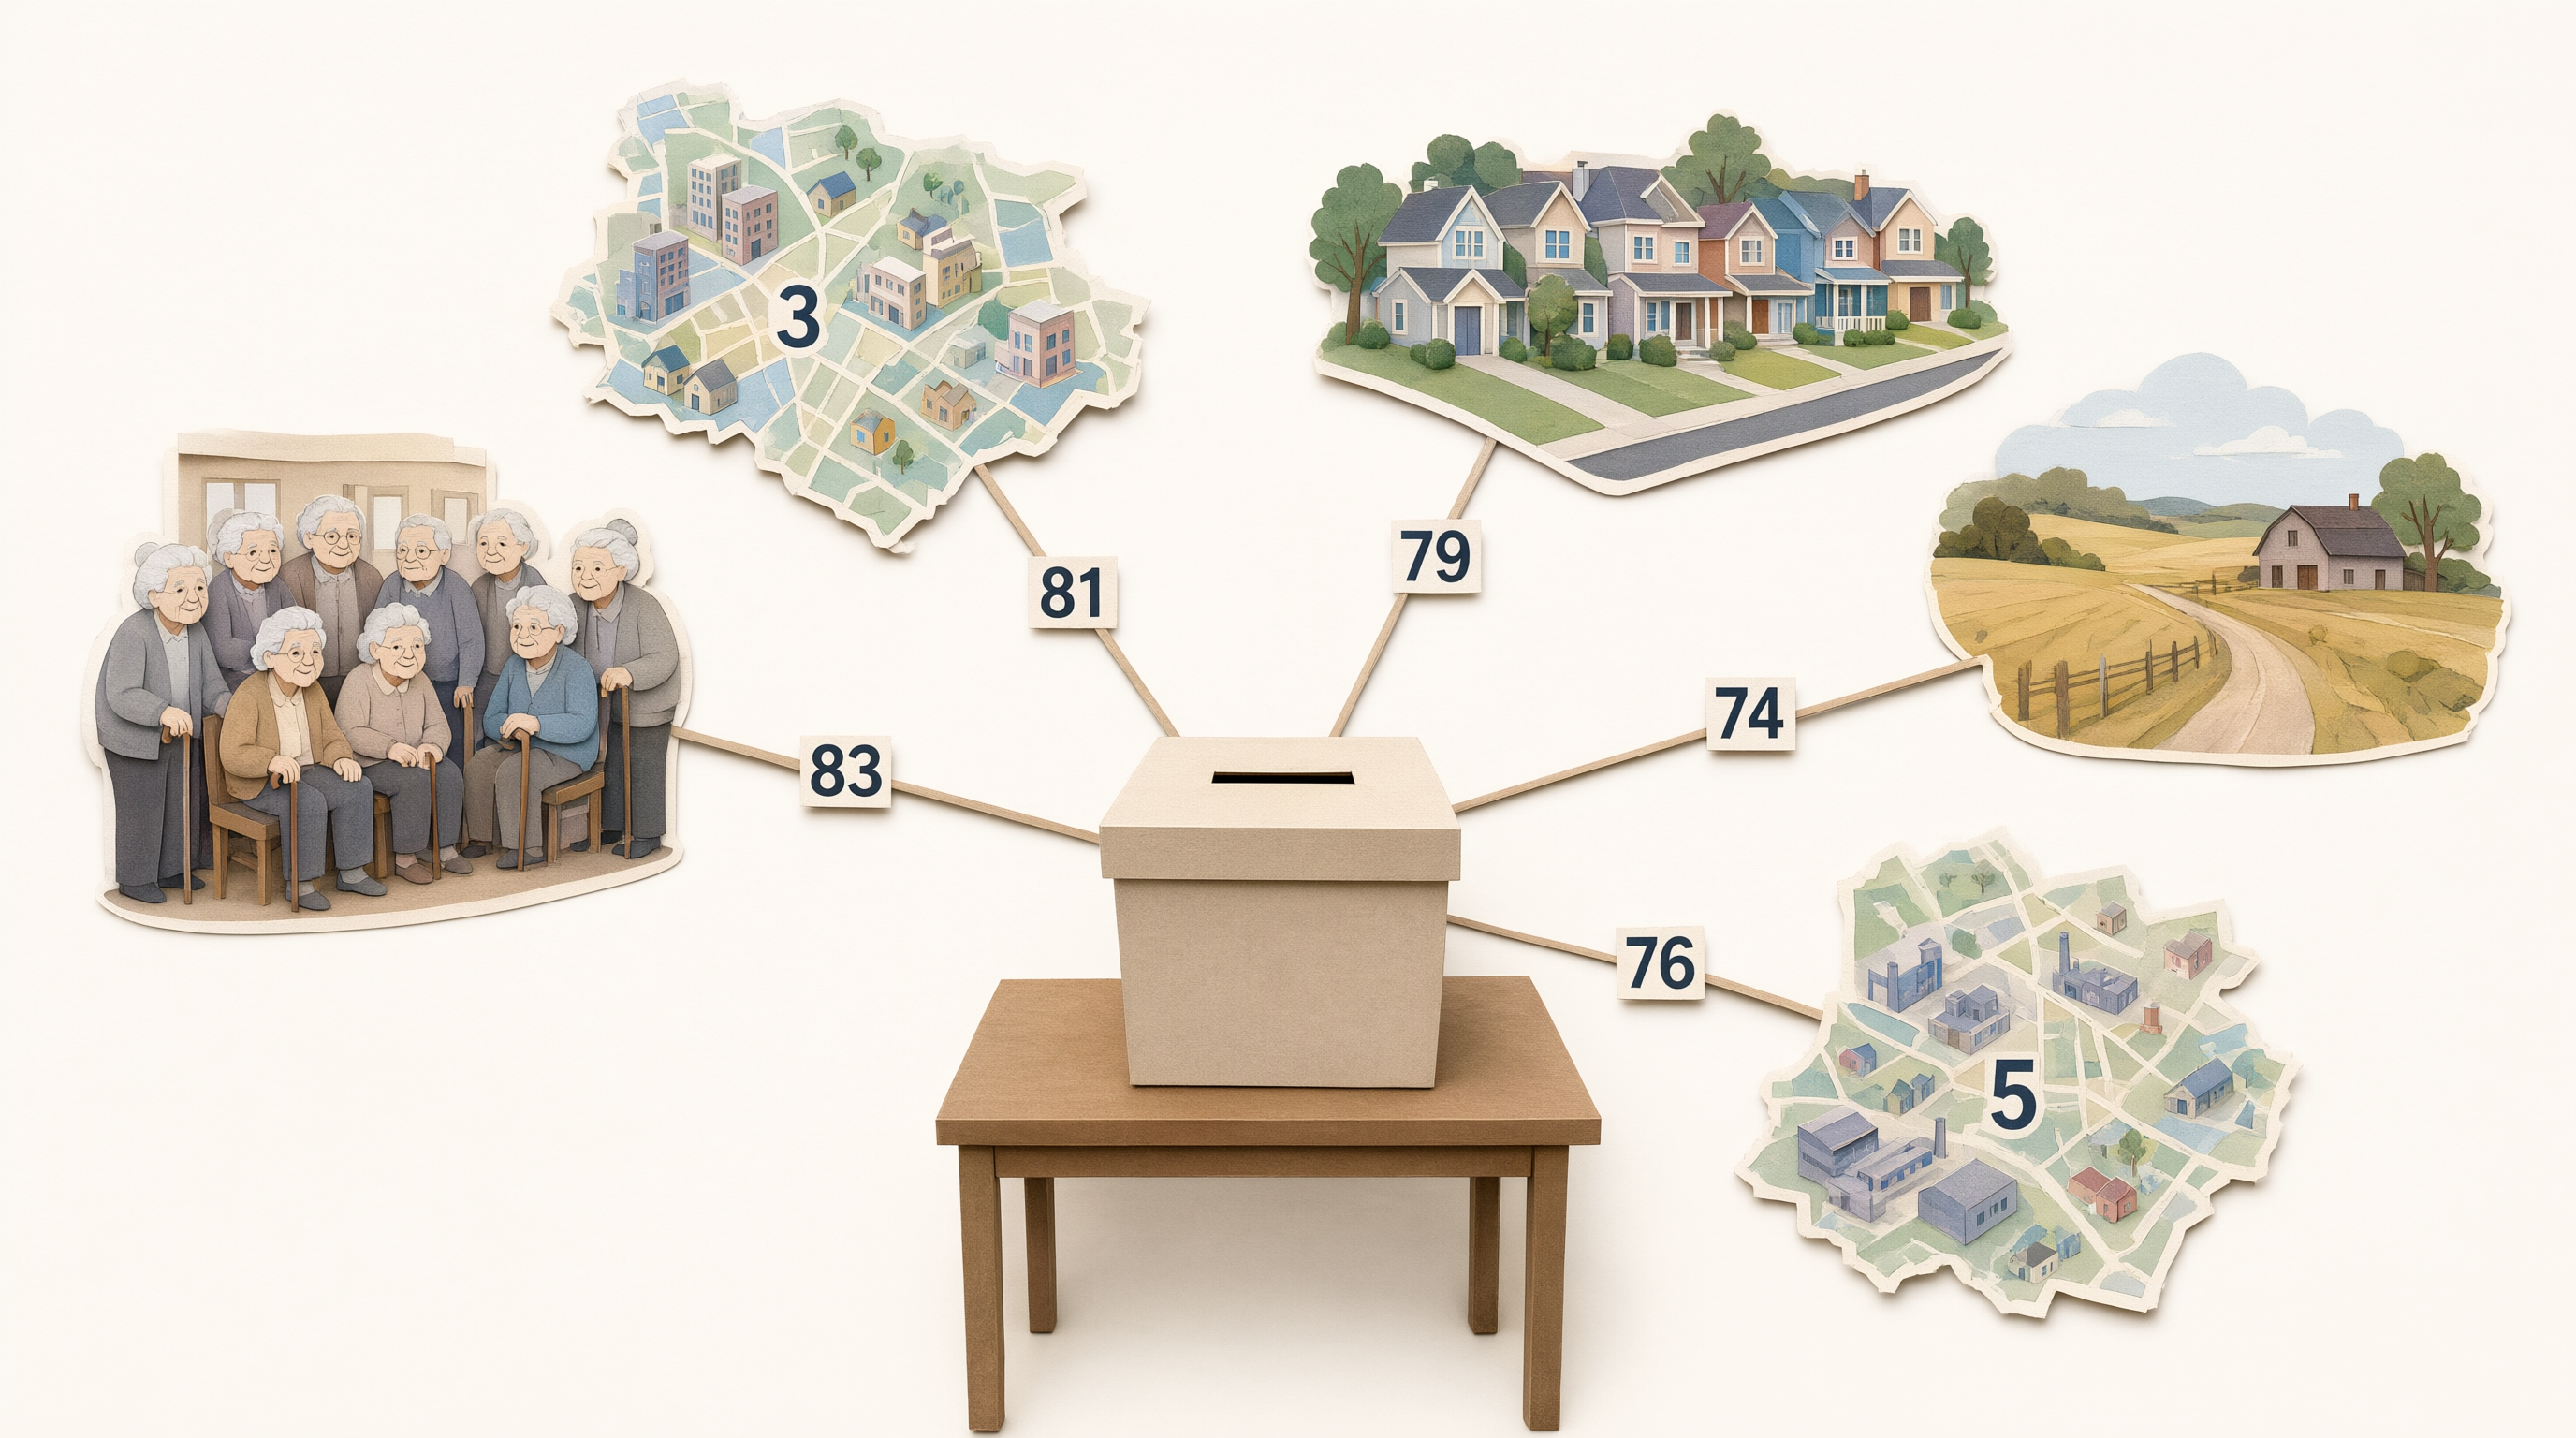
This is the overall picture of voter turnout across our key segments and districts. The elderly population shows the highest turnout at 83%, followed closely by District 3 at 81% and suburban areas at 79%. District 5 and rural areas trail slightly at 76% and 74%, respectively.
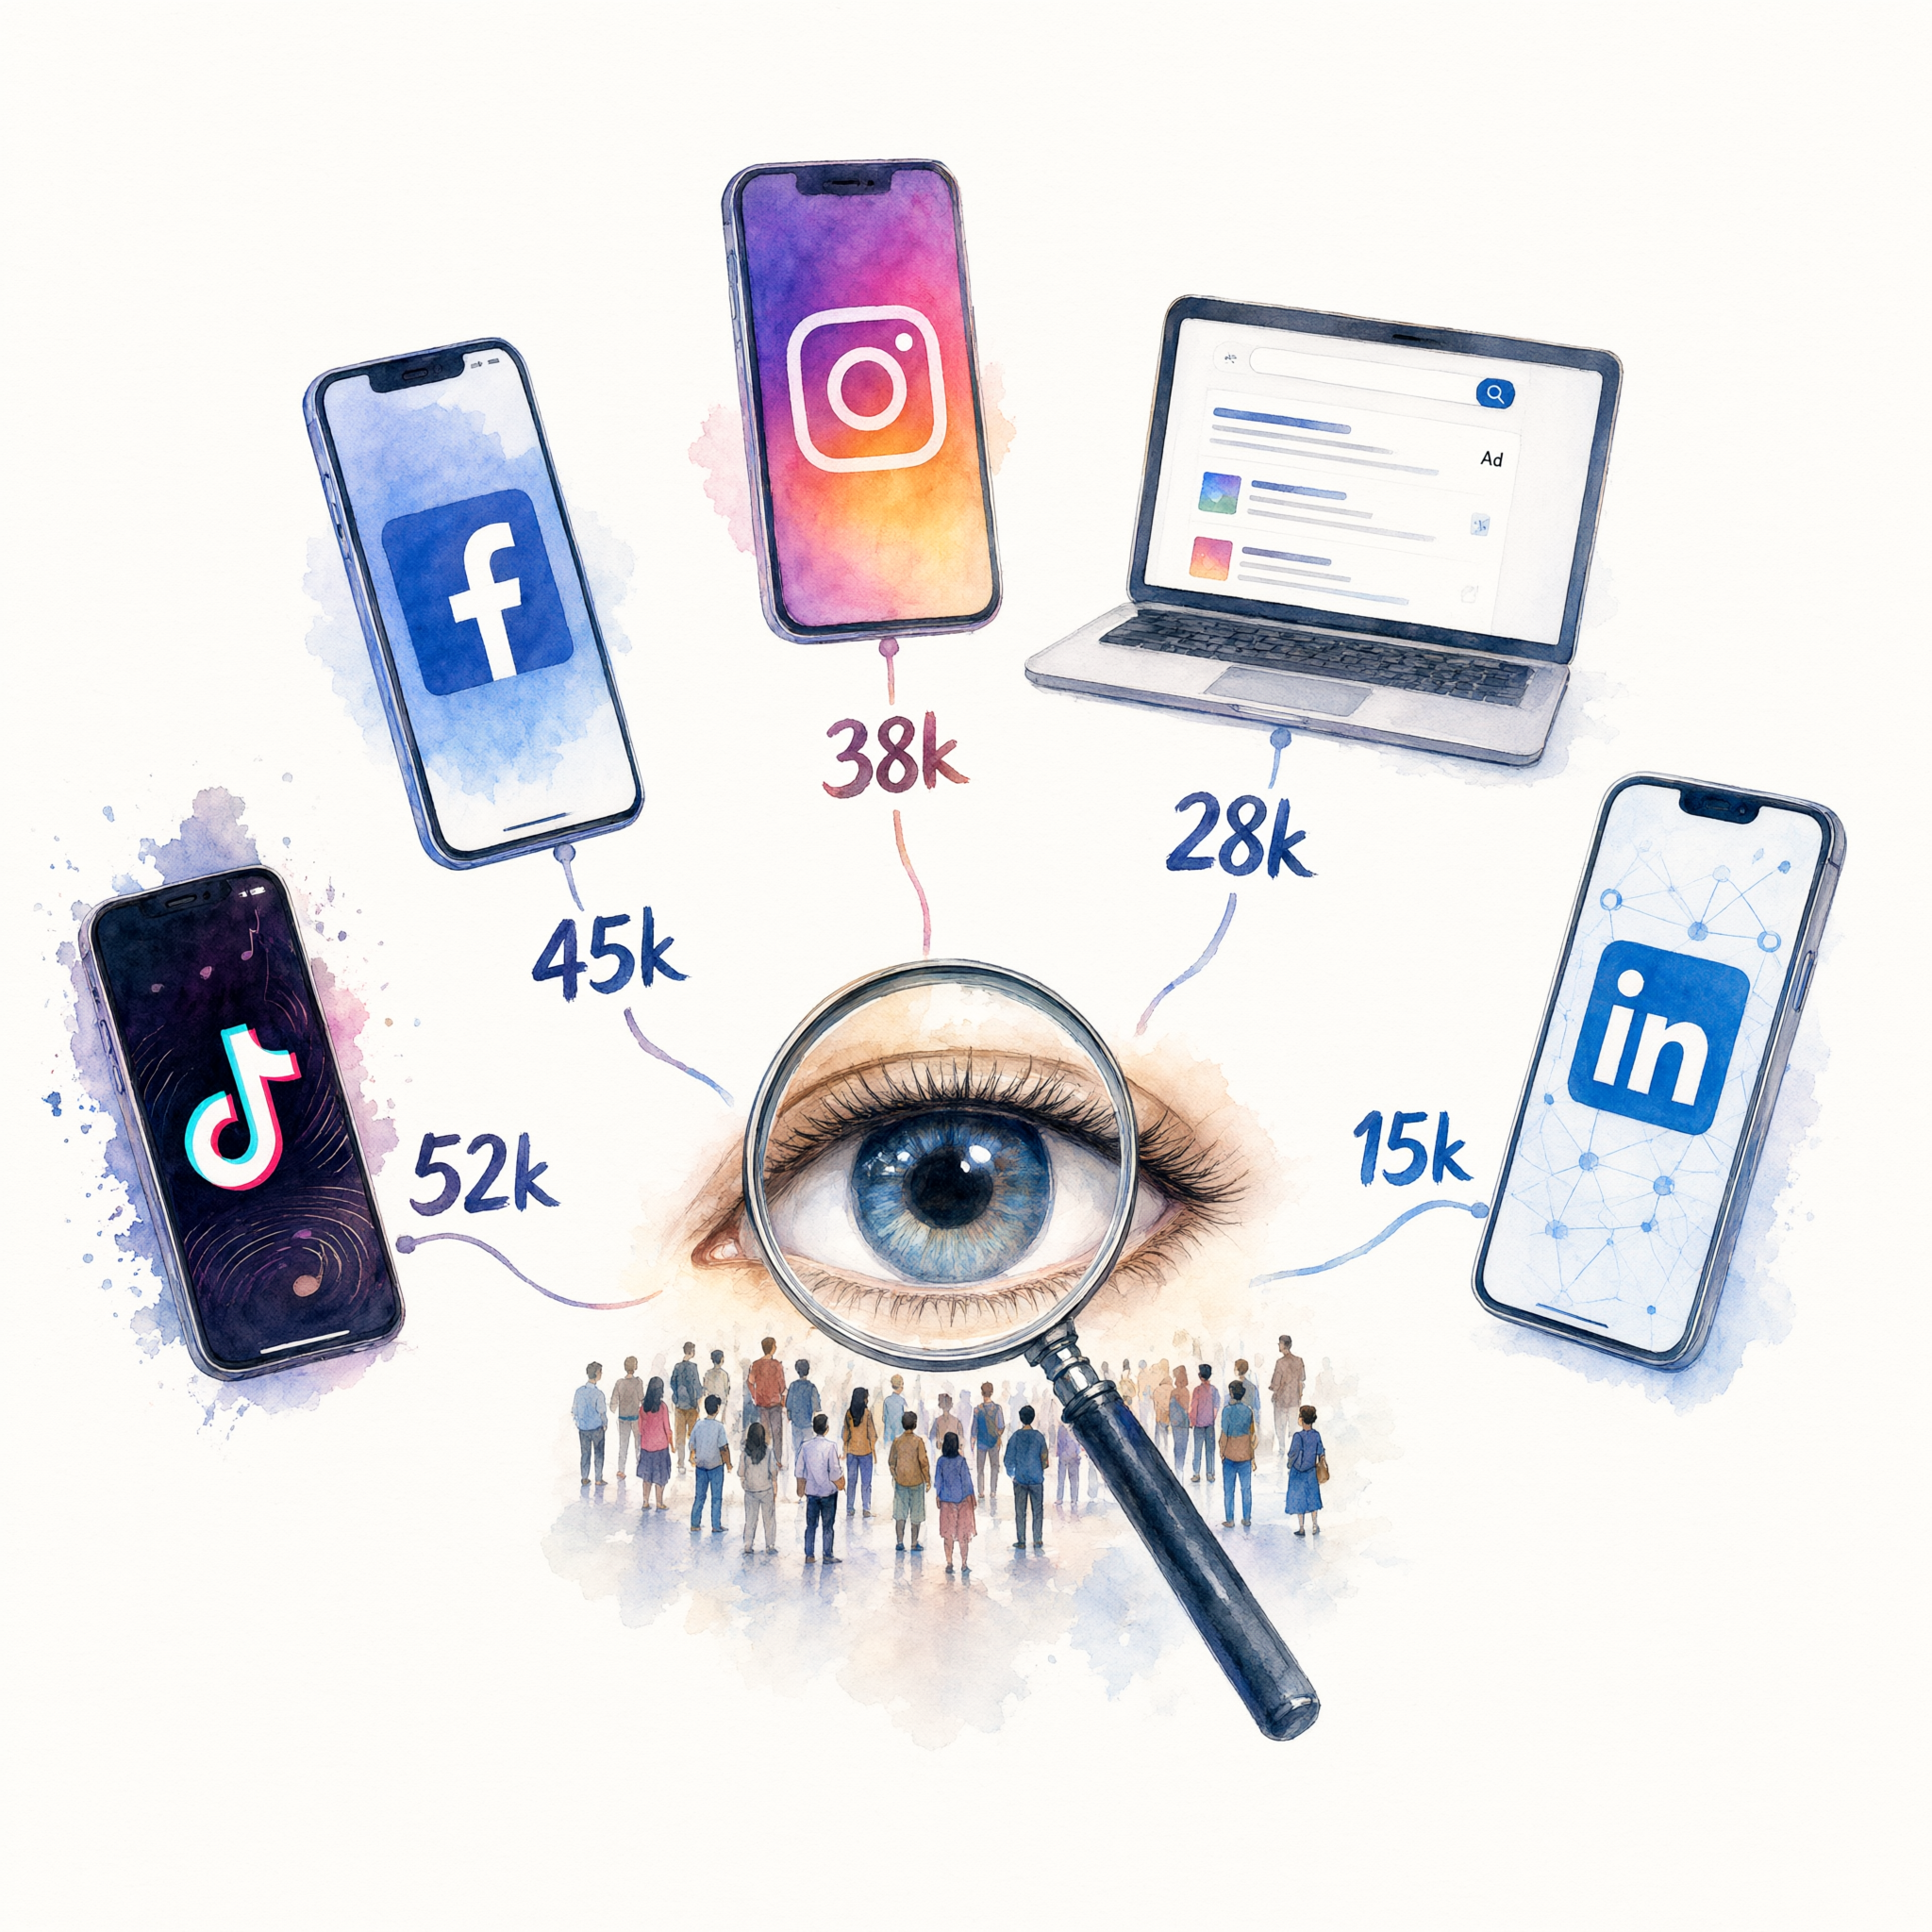
This overview shows all five social media platforms funneling their impressions into a single central metric—Impressions. TikTok leads with 52,000 impressions, followed by Facebook at 45,000, Instagram at 38,000, Google Ads at 28,000, and LinkedIn at 15,000. Together, these channels contribute a total of 178,000 impressions to our campaign.
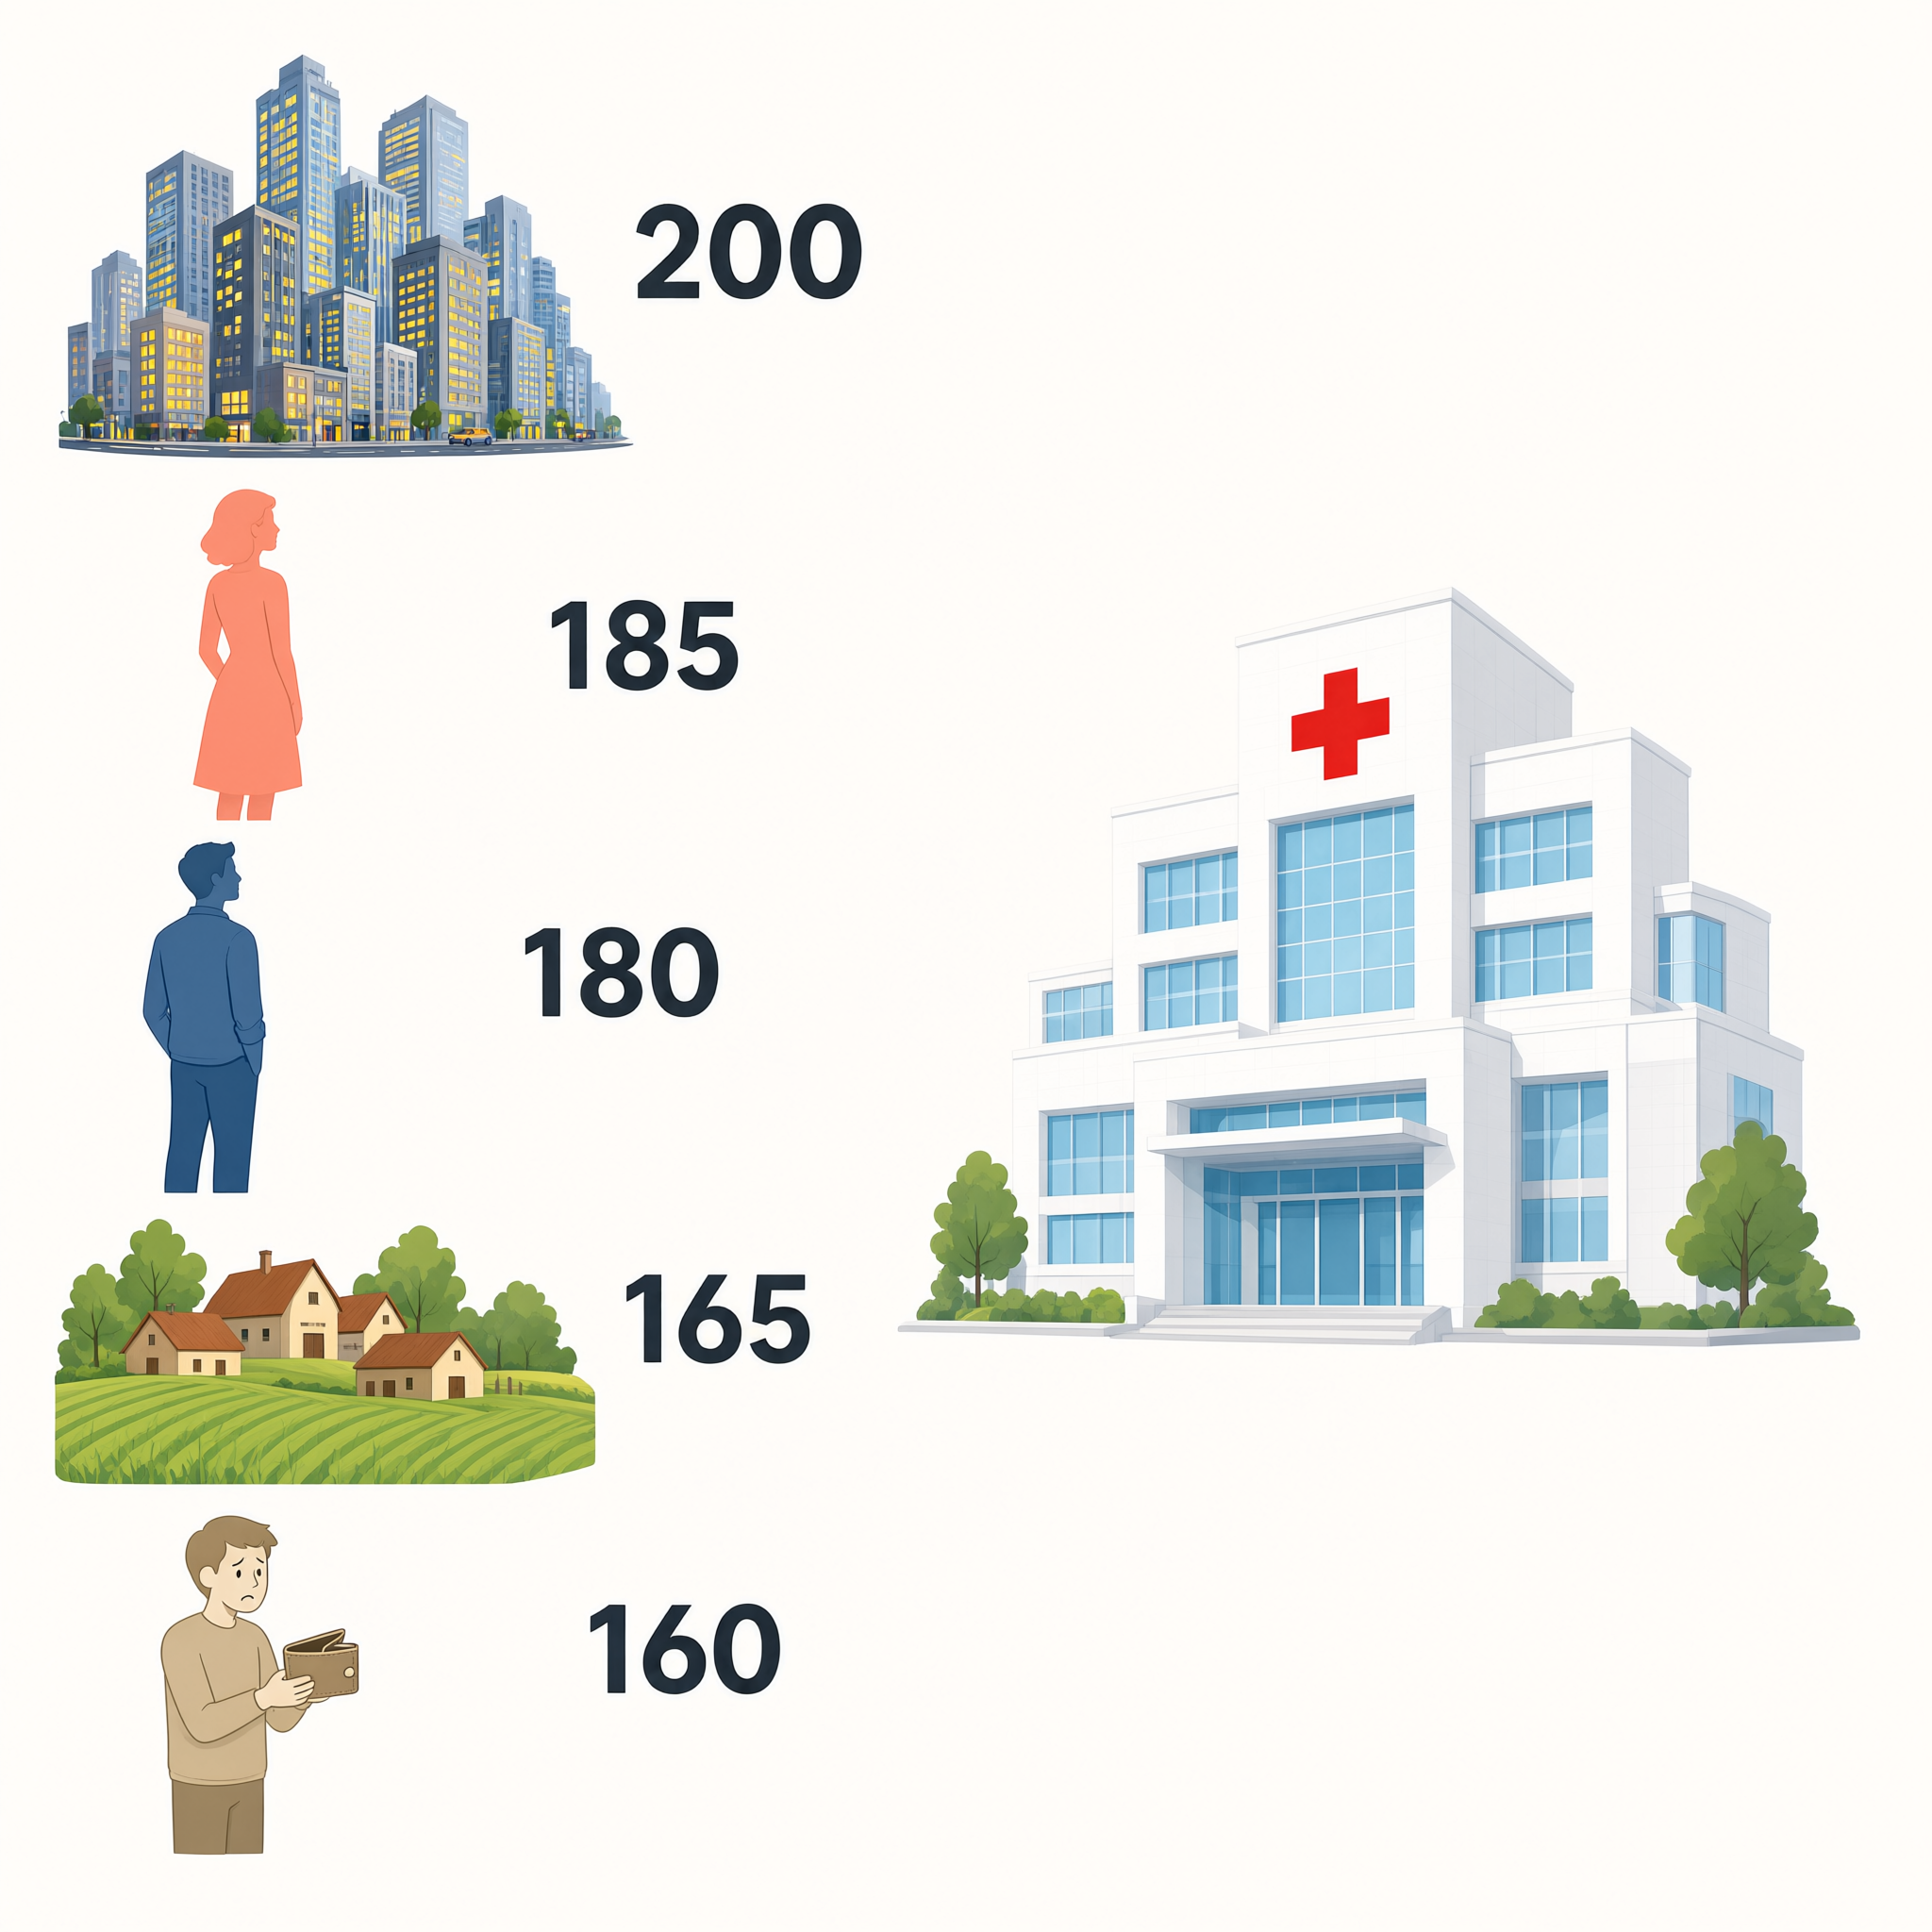
This overview shows all the factors that contribute to patients not being readmitted. Urban areas have the highest count at 200, followed by female patients at 185 and male patients at 180. Rural areas and underinsured patients contribute 165 and 160 respectively.
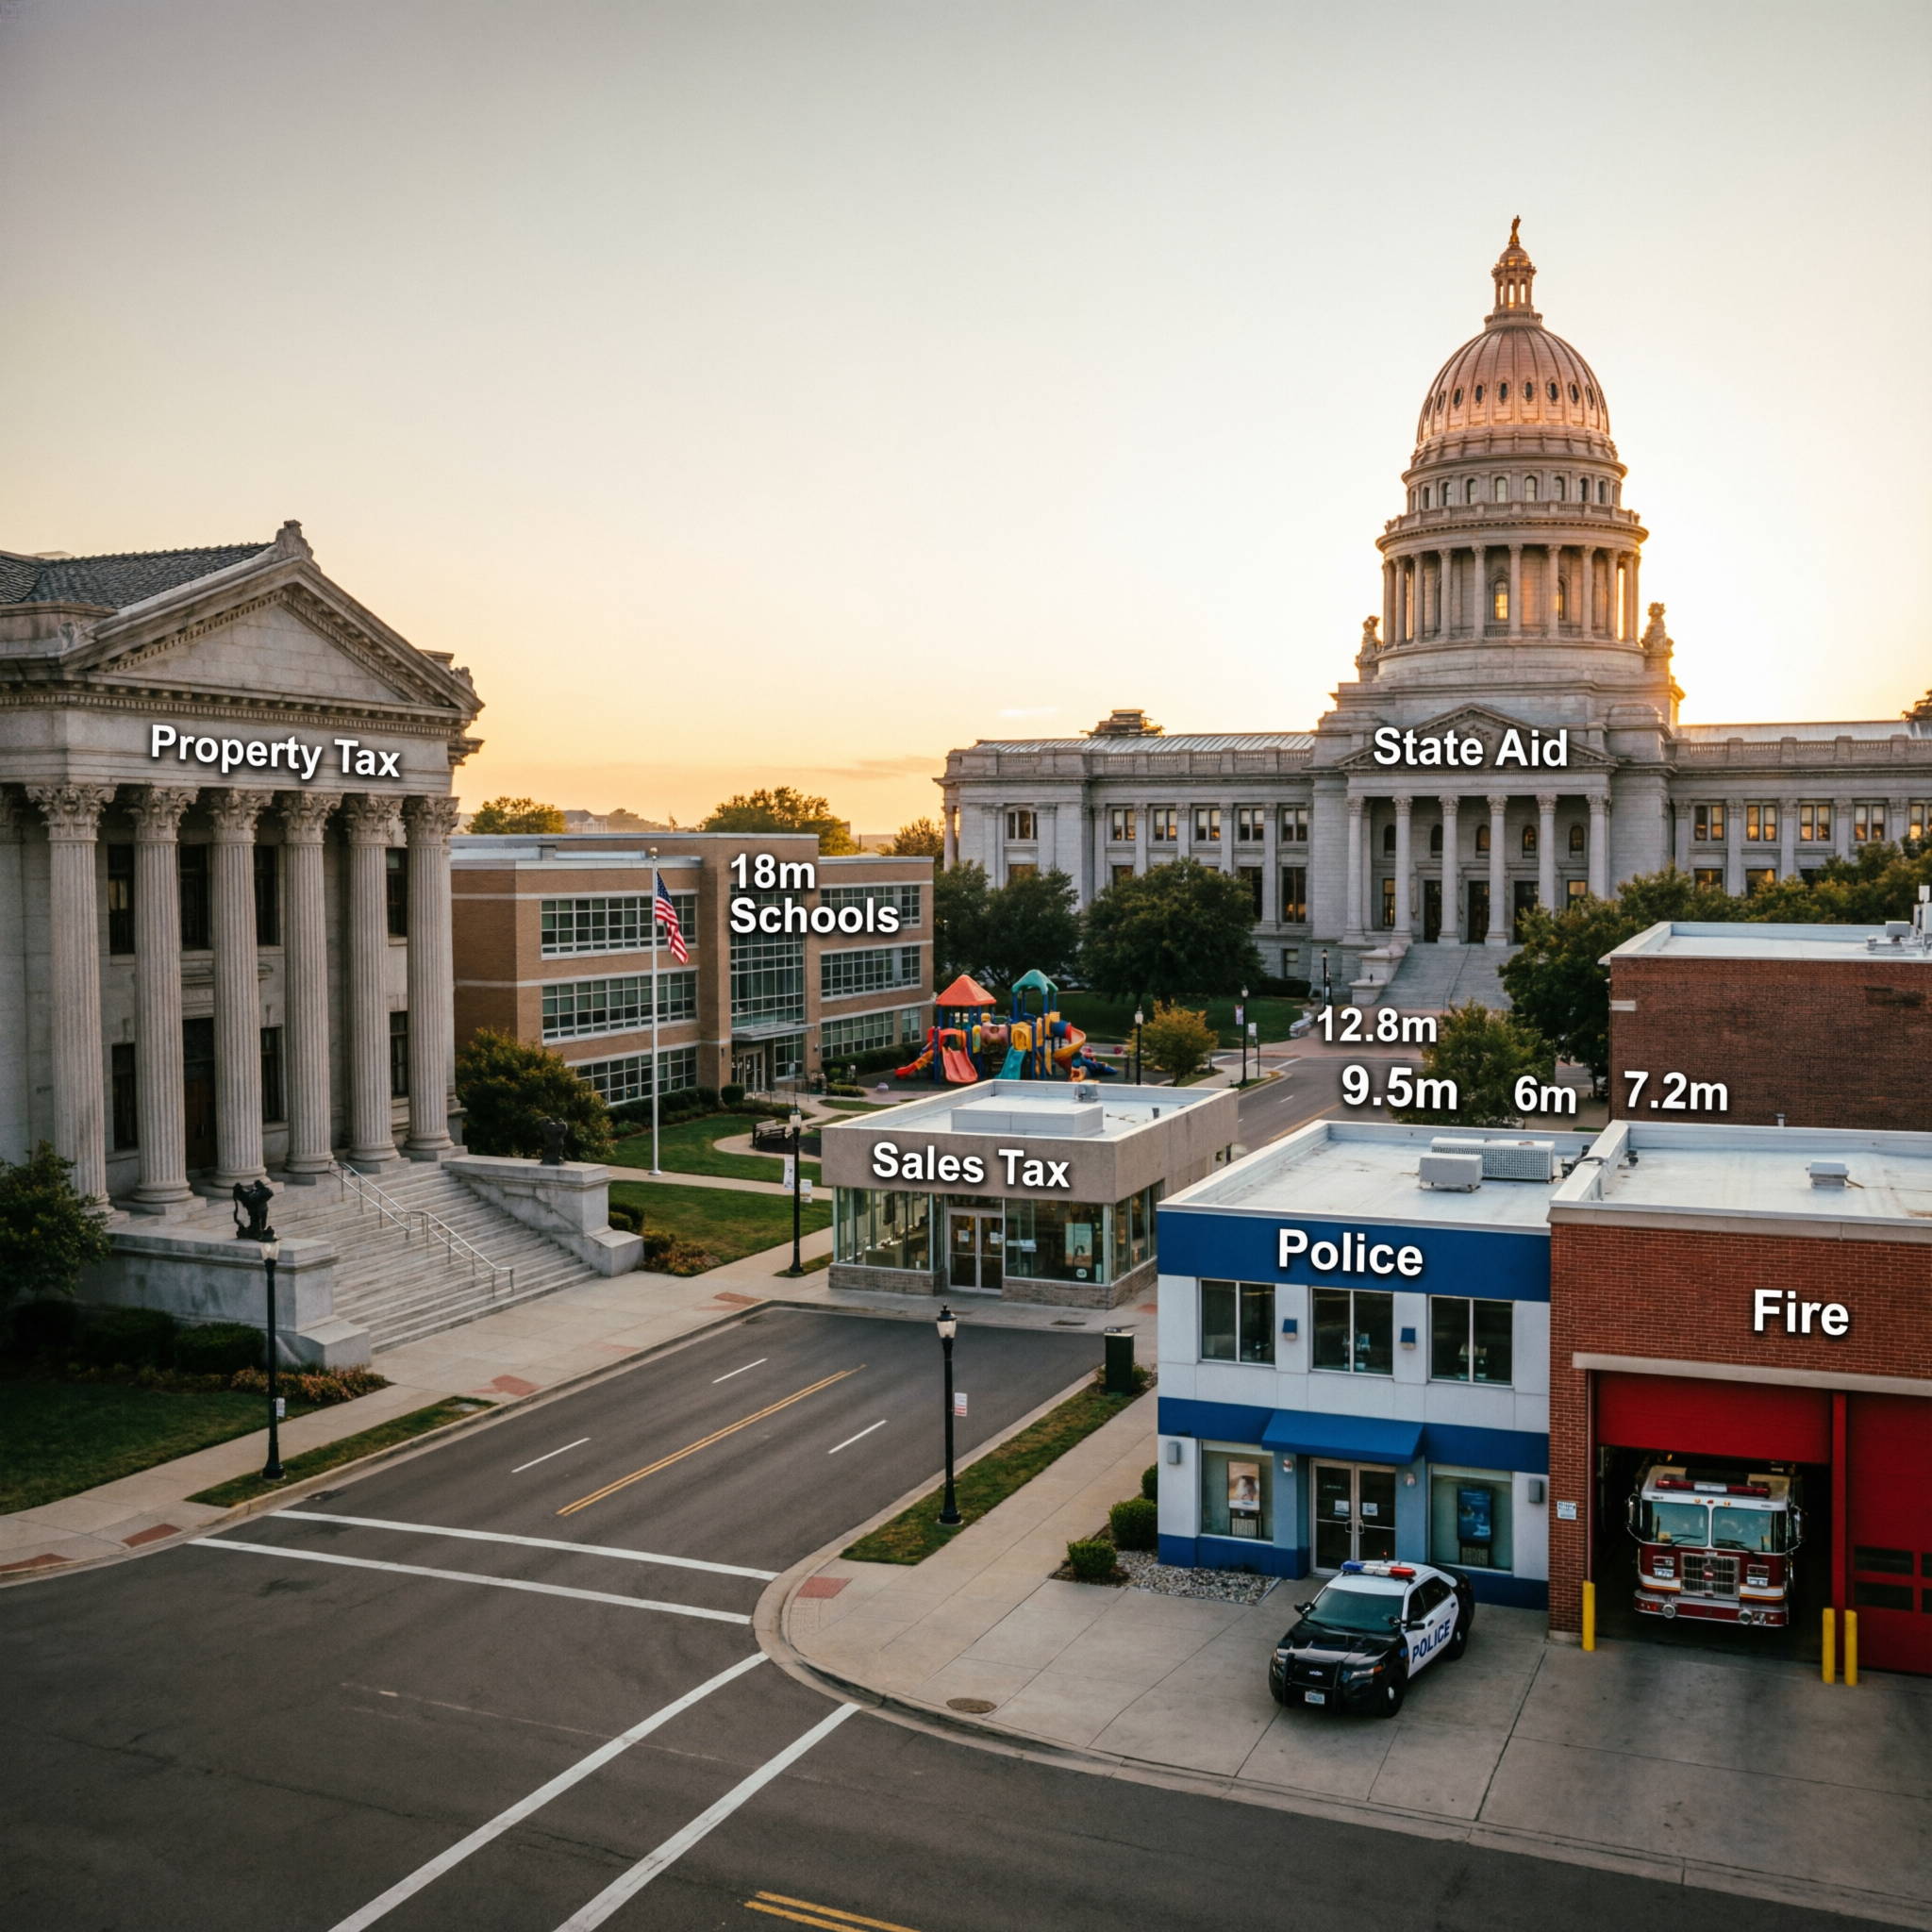
This overview shows all the funding sources and recipients at a glance. Property tax and sales tax are the main local revenue streams, while state aid provides additional support. Schools receive the largest total funding, followed by police and fire services.
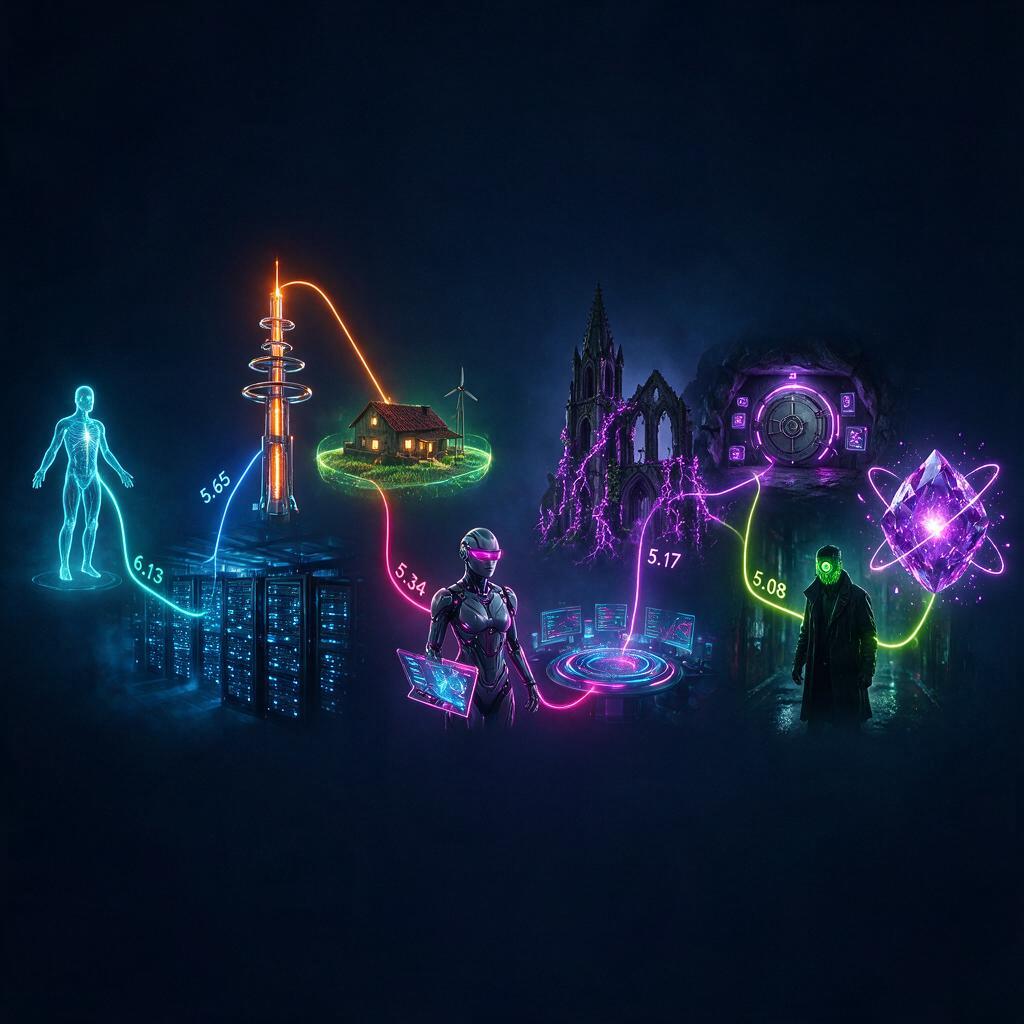
This overview shows the entire data flow from start to finish. We begin with jamelle, who contributes 6.13 units, and then the value moves through a series of transformations and intermediaries, ending with Aaron Rupar at 5.08. Each step represents a decrease in value, which we'll examine in detail next.
This overview shows the entire flow from the source on the left through all the intermediate figures to the final destinations on the right. The values on the arrows are all in the range of 1 to 1.3 thousand, indicating a steady distribution of something across the network.

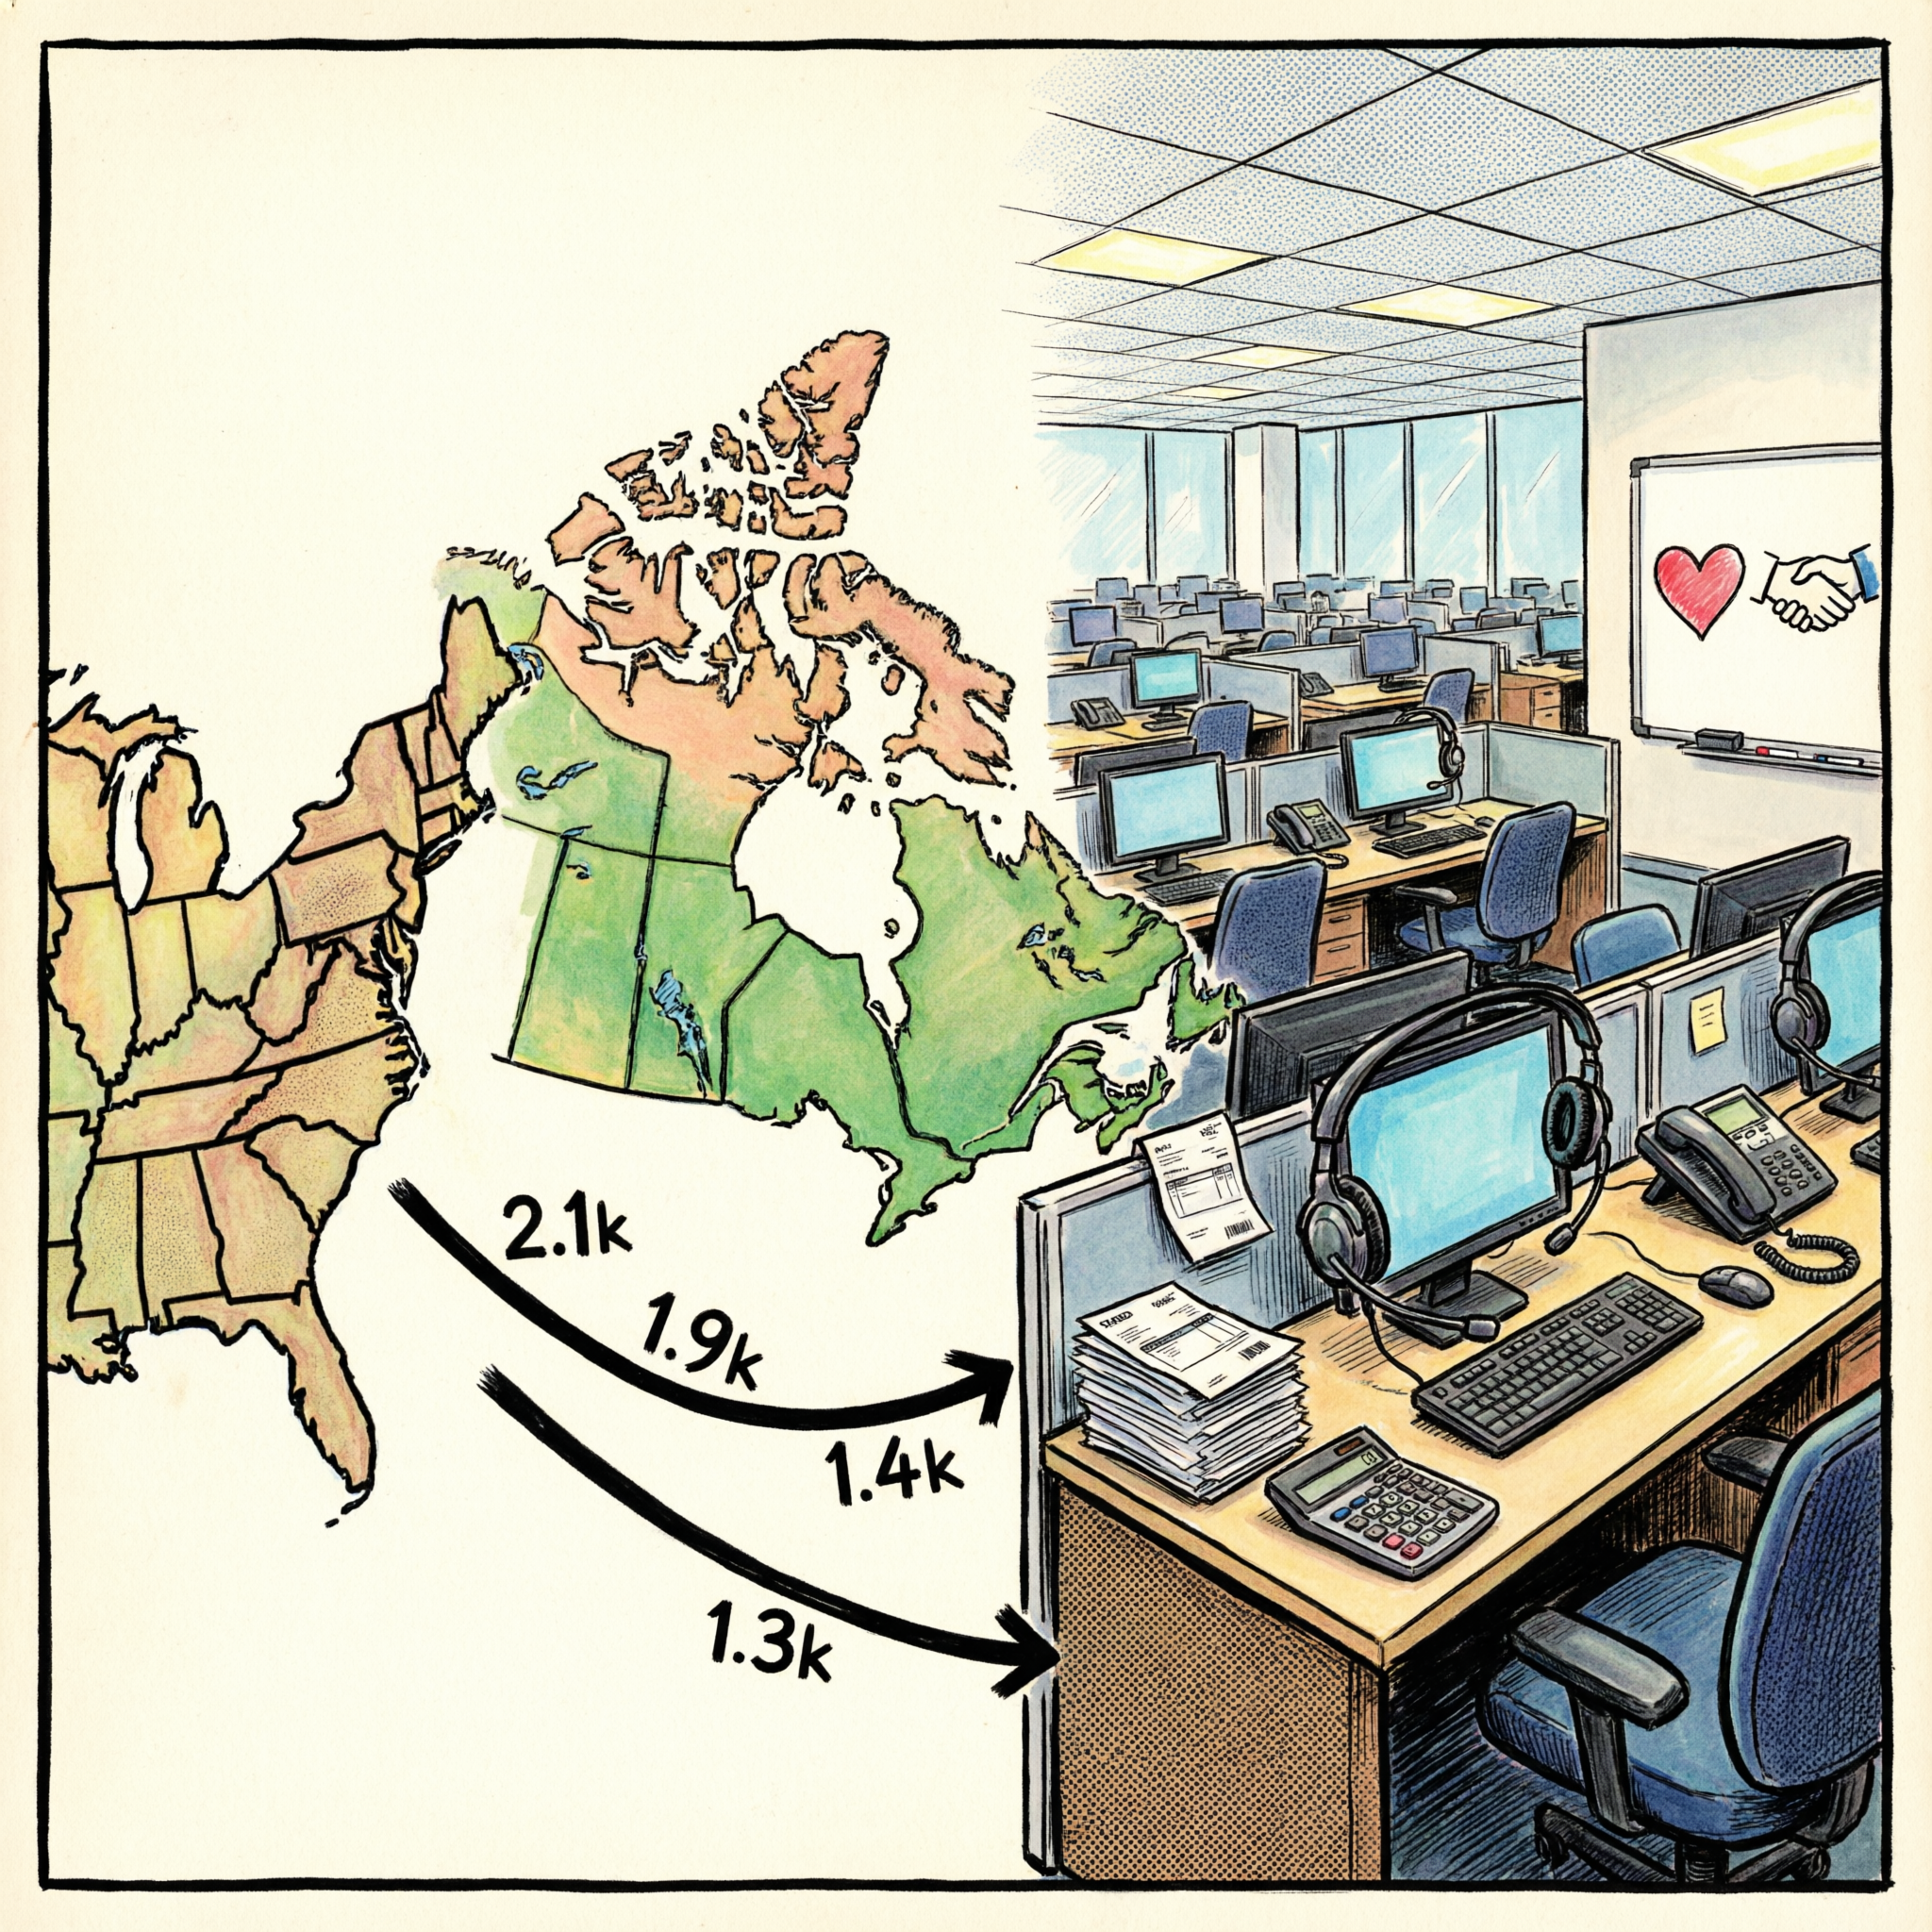
This overview shows the complete picture: the United States and Canada are the two sources of activity, and all traffic flows to three internal departments—Tech Support, Billing, and Retention. The largest flows come from the US, with 2.1k to Tech Support and 1.9k to Billing, while Canada contributes 1.3k to both Tech Support and Billing. Retention receives the smallest flow, 1.4k, from the US only.